Fig. A.1.
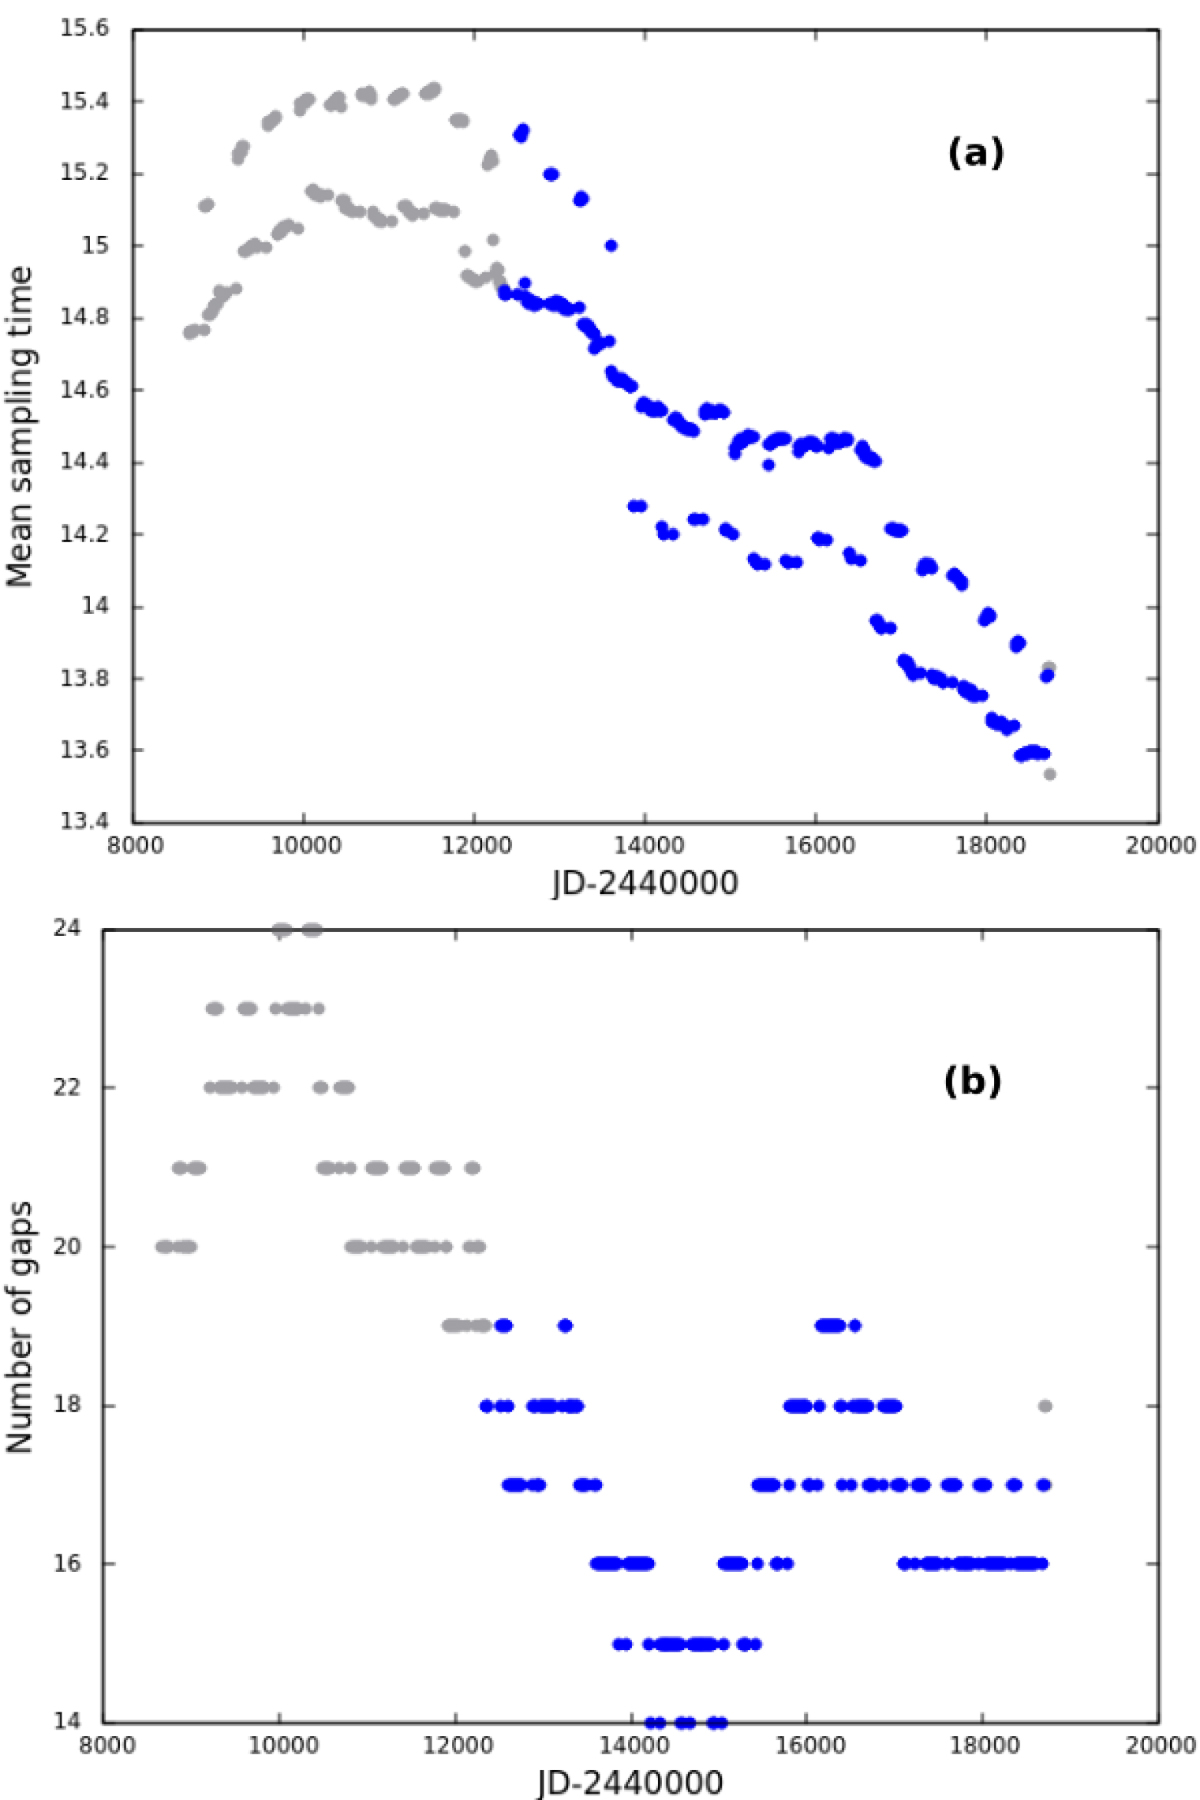
Variation in (panel a) mean sampling time and (panel b) number of gaps of the light curve over time. The gray dots represent the period from 1980–1990, and the blue dots show the period from 1990 onward. The oscillation in panel a is due to the periodic gaps that arise from lack of visibility of α-Orionis during part of the year.
Current usage metrics show cumulative count of Article Views (full-text article views including HTML views, PDF and ePub downloads, according to the available data) and Abstracts Views on Vision4Press platform.
Data correspond to usage on the plateform after 2015. The current usage metrics is available 48-96 hours after online publication and is updated daily on week days.
Initial download of the metrics may take a while.