Fig. 1.
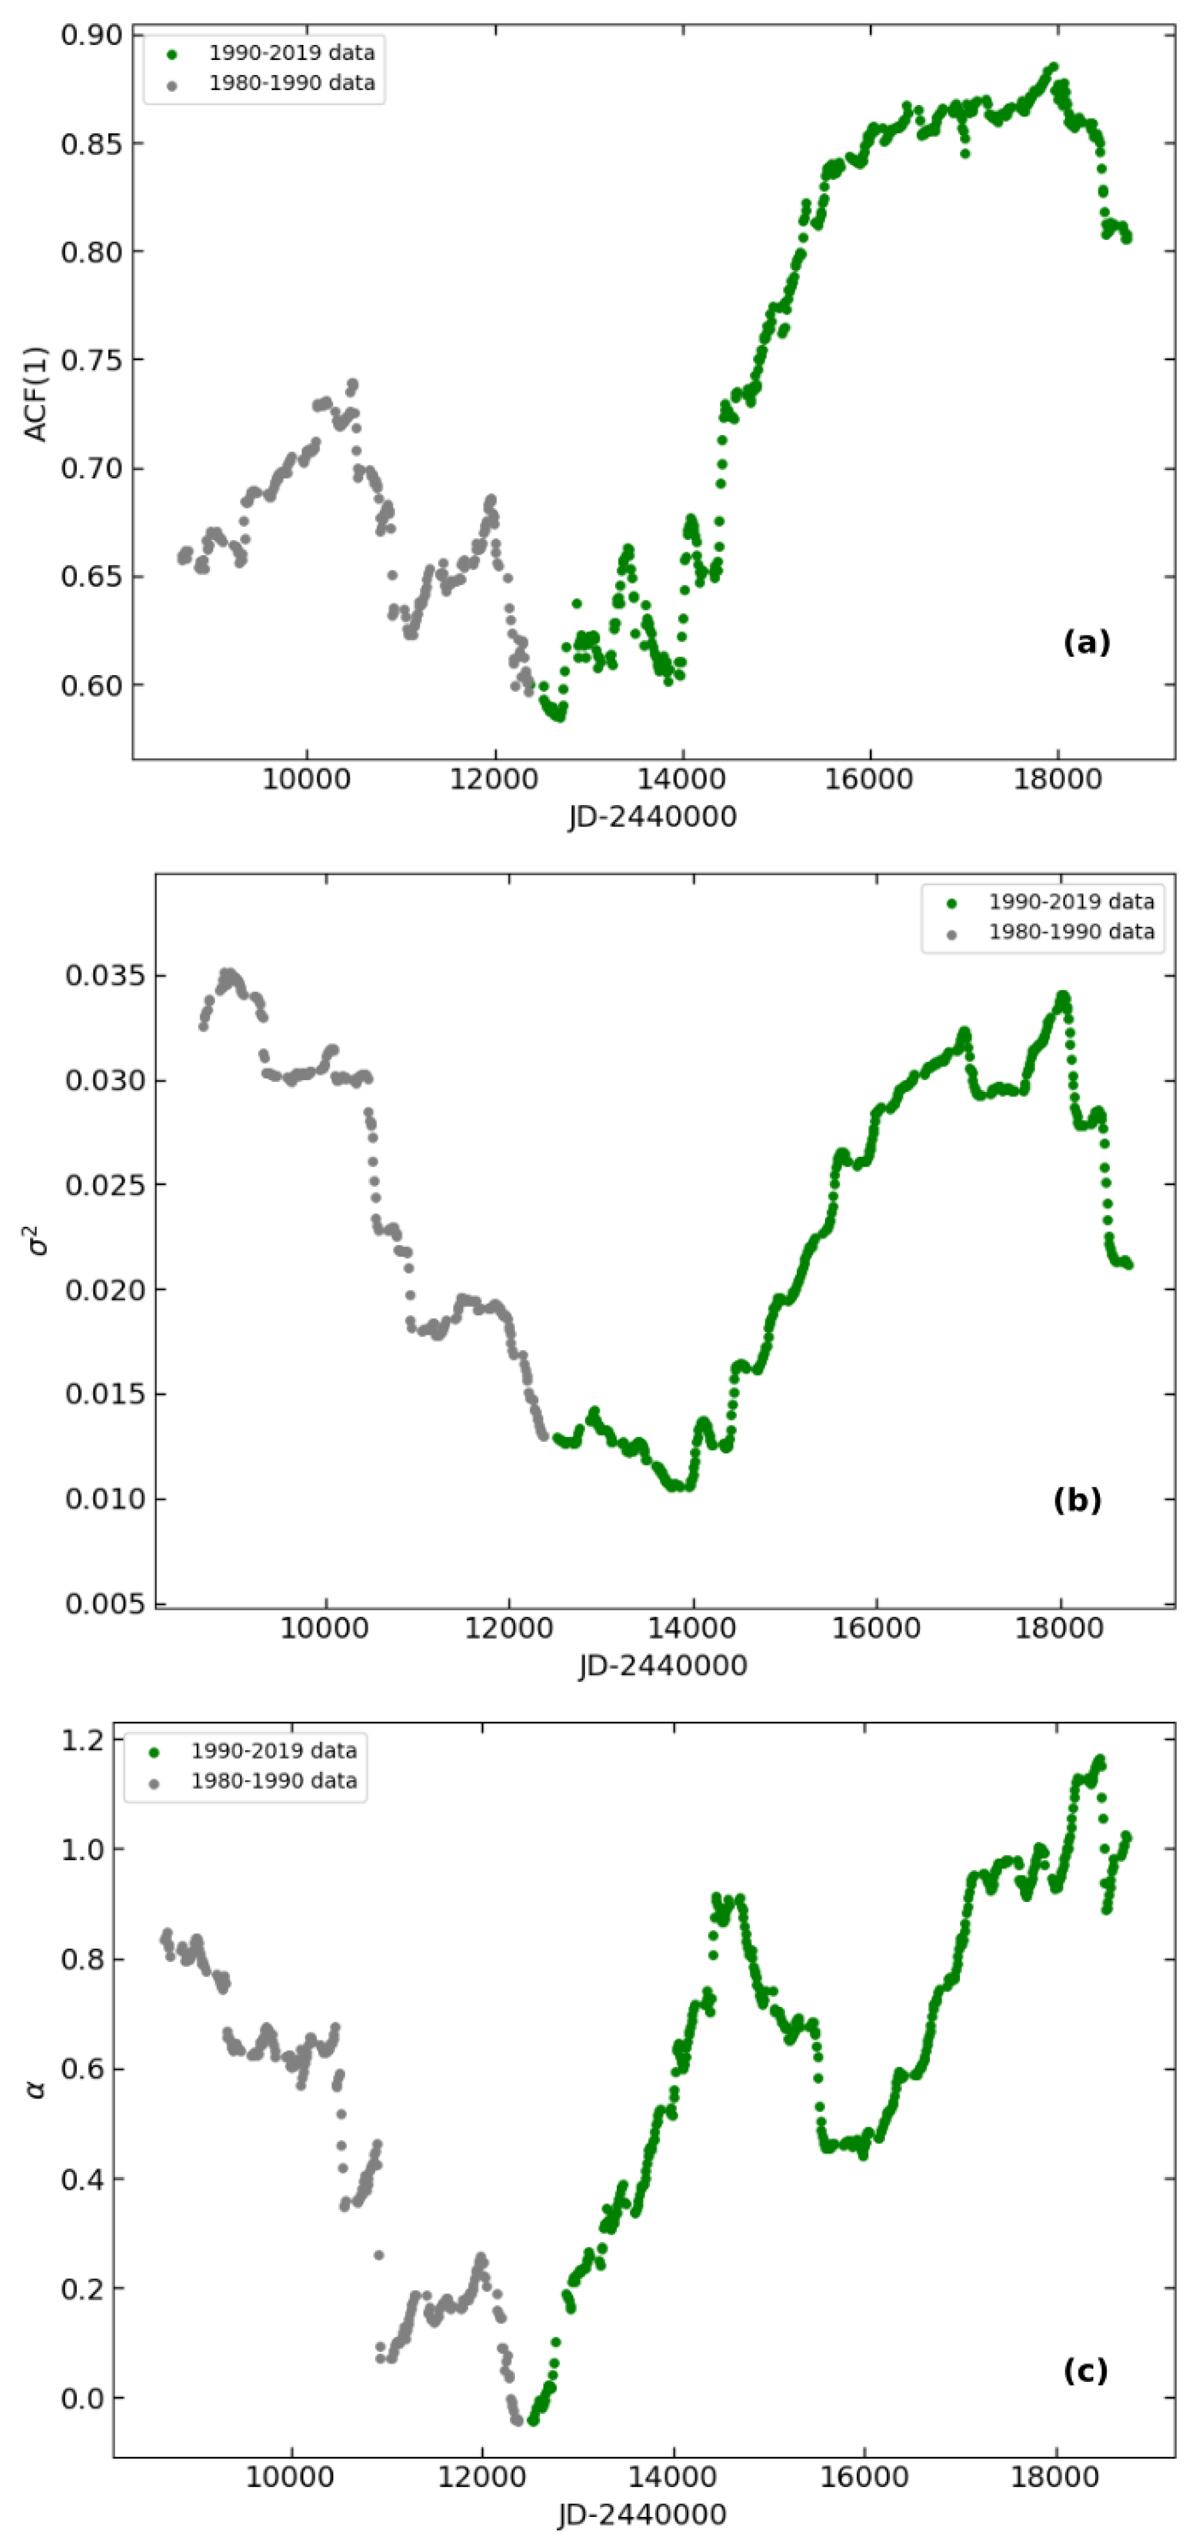
Variation in (panel a) autocorrelation at lag-1, (panel b) variance, and (panel c) spectral coefficient, α, calculated from detrended fluctuation analysis prior to the dimming event. The period from 1980–1990 is shown in gray, and the period from 1990 onward is shown in green. A visible rise can be seen leading towards the event. The calculated quantifier is plotted at the end time of the moving window.
Current usage metrics show cumulative count of Article Views (full-text article views including HTML views, PDF and ePub downloads, according to the available data) and Abstracts Views on Vision4Press platform.
Data correspond to usage on the plateform after 2015. The current usage metrics is available 48-96 hours after online publication and is updated daily on week days.
Initial download of the metrics may take a while.