Free Access
Fig. A.1.
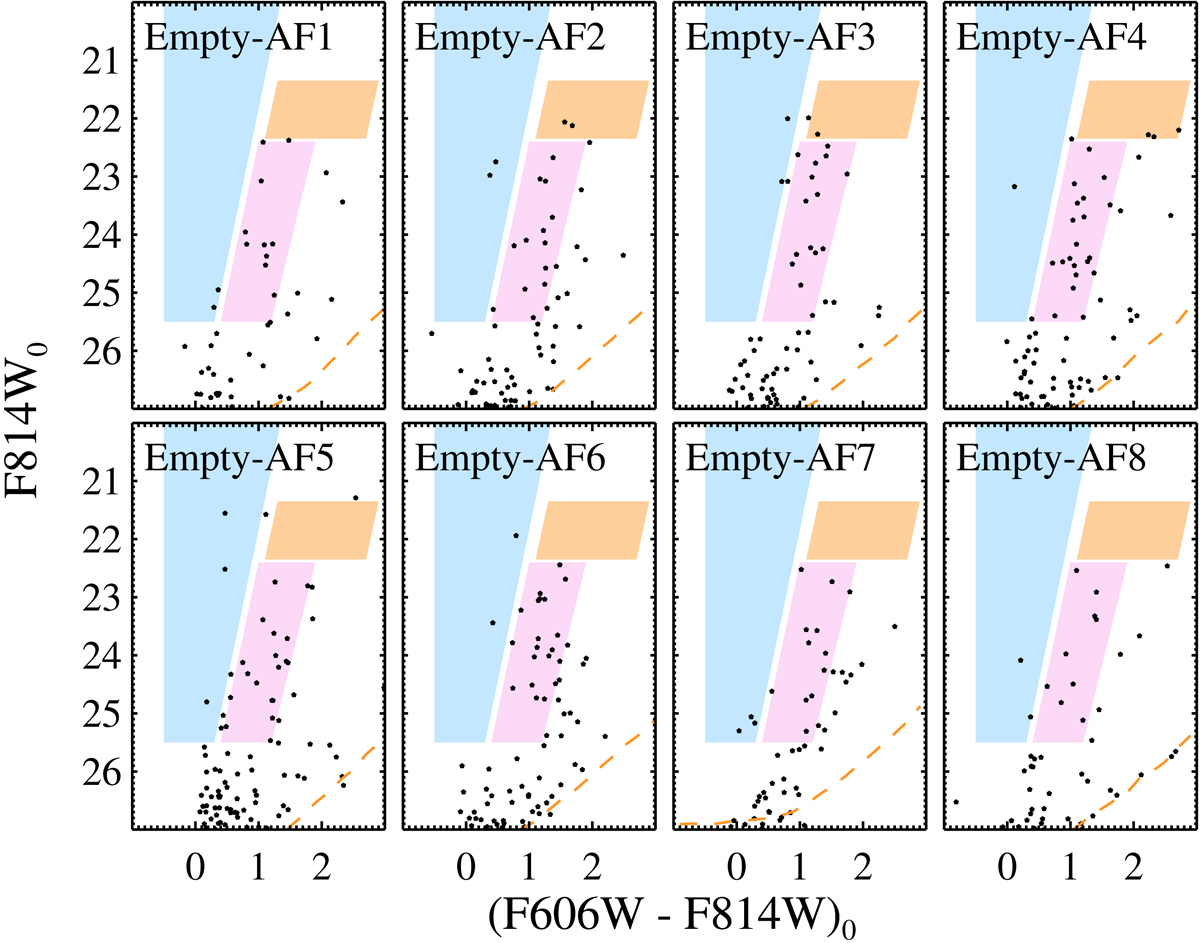
Color-magnitude diagrams for the selected point sources in the eight empty fields taken with ACS/WFC. We correct for the foreground extinction toward each field using the values in Schlafly & Finkbeiner (2011). Shaded regions are the same as those in Fig. 2. Dashed lines represent the 50% completeness limits.
Current usage metrics show cumulative count of Article Views (full-text article views including HTML views, PDF and ePub downloads, according to the available data) and Abstracts Views on Vision4Press platform.
Data correspond to usage on the plateform after 2015. The current usage metrics is available 48-96 hours after online publication and is updated daily on week days.
Initial download of the metrics may take a while.