Fig. 5.
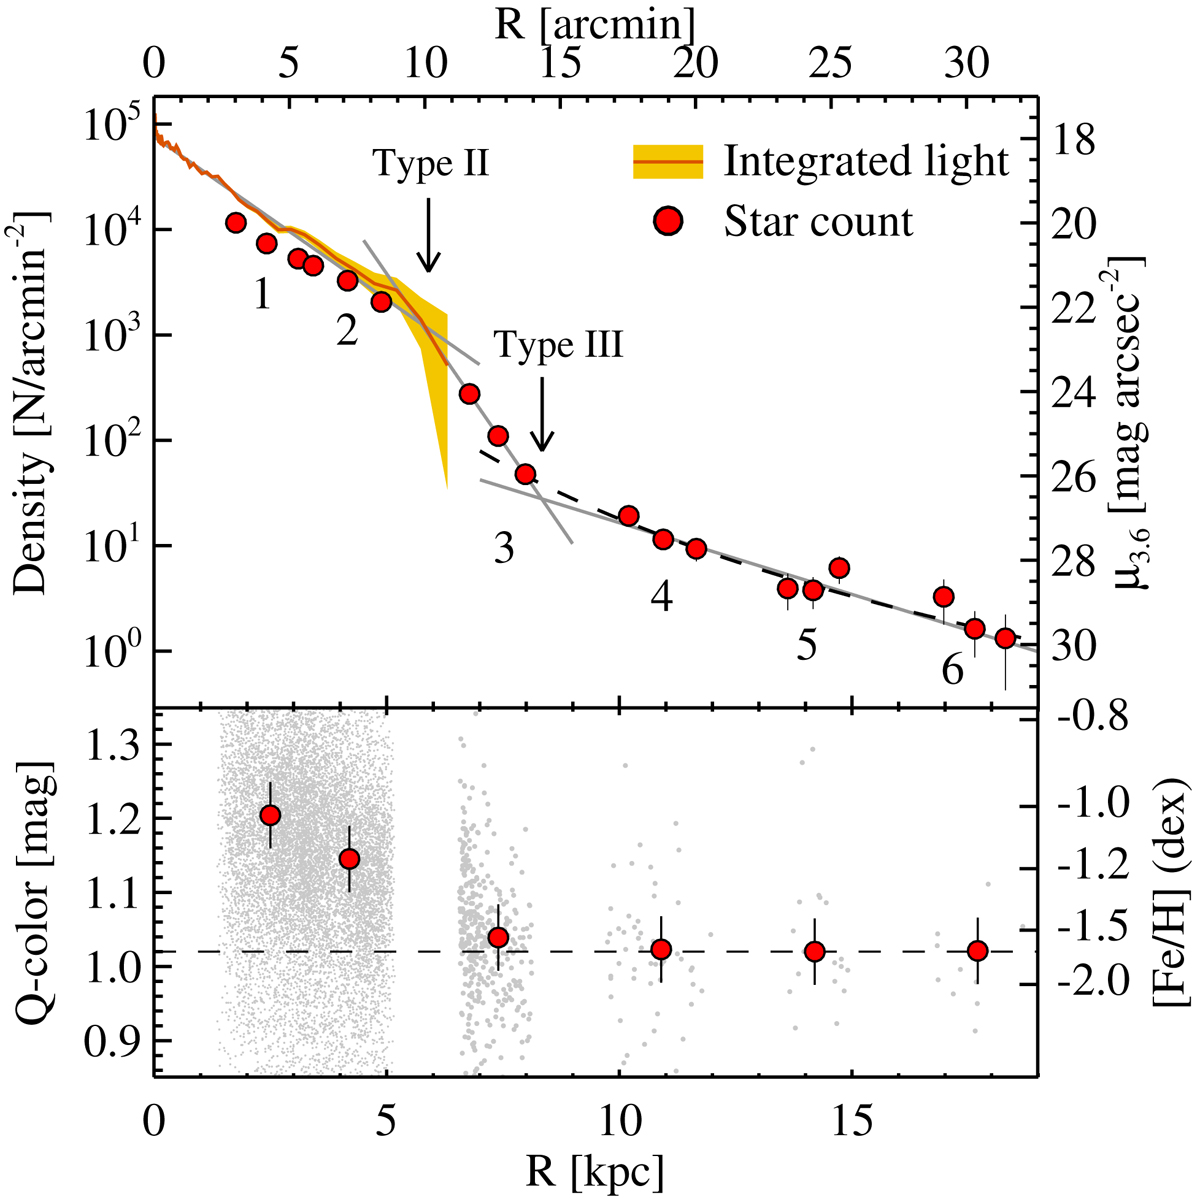
Top: stellar density profile along the NGC 300 major axis. RGB star counts are shown by circles. The orange line with a shaded region indicates the integrated light profile in the Spitzer 3.6 μm band. Surface brightness is shown on the right y-axis, and can be converted to V-mag by adding ∼2.0 mag. Solid lines indicate fits to the resulting three regions using exponential-law models. Also shown is a fit to the outermost component with a power law (dashed line). Bottom: Q-color distribution of the bright RGB stars with F814W ≤ 24.5 mag. Individual stars and their median colors are indicated by gray dots and red circles, respectively.
Current usage metrics show cumulative count of Article Views (full-text article views including HTML views, PDF and ePub downloads, according to the available data) and Abstracts Views on Vision4Press platform.
Data correspond to usage on the plateform after 2015. The current usage metrics is available 48-96 hours after online publication and is updated daily on week days.
Initial download of the metrics may take a while.