Fig. 4.
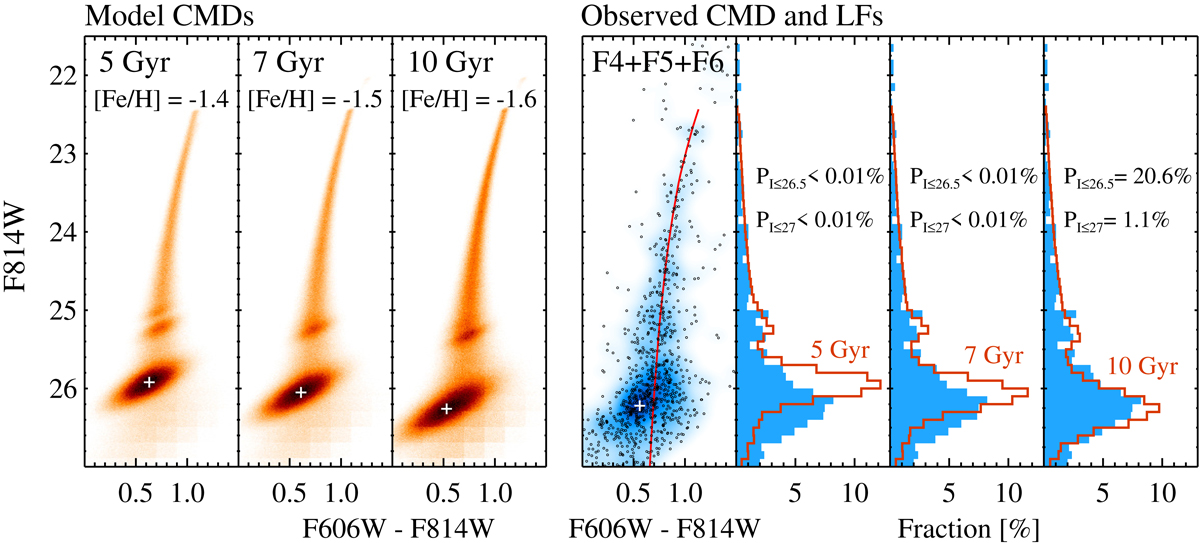
Left three panels: Hess diagrams for the simulated 5, 7, and 10 Gyr simple stellar populations at the distance of NGC 300. The highest density regions of the RC are marked by crosses. We note the gradual change of the RC magnitudes as a function of age. Right four panels: observed CMD of F4, F5, and F6 and its LF (filled histograms) overplotted with the model LFs (open histograms). The red curved line in the CMD represents the stellar isochrone for age = 10 Gyr and [Fe/H] = −1.6 in the Padova models. The probability (P) of the Kolmogorov–Smirnov test for the stars brighter than F814W = 26.5 and 27 mag are marked in the panels with LFs.
Current usage metrics show cumulative count of Article Views (full-text article views including HTML views, PDF and ePub downloads, according to the available data) and Abstracts Views on Vision4Press platform.
Data correspond to usage on the plateform after 2015. The current usage metrics is available 48-96 hours after online publication and is updated daily on week days.
Initial download of the metrics may take a while.