Fig. 3.
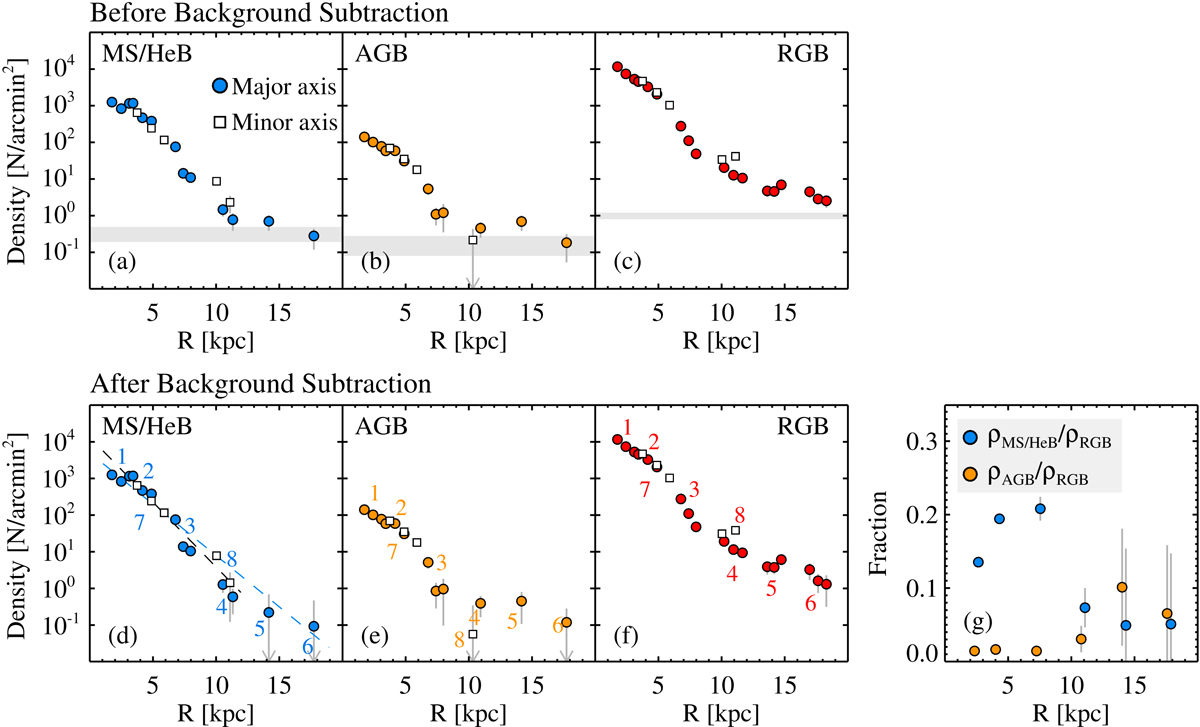
Top: radial star count profiles for the MS/HeB (a), AGB (b), and RGB (c) stars in NGC 300. Circles and squares indicate the profiles along the major and minor axes of the galaxy, respectively. The approximate background levels of each population are marked by shaded regions. Bottom: same as top but after background subtraction. Numbers in each panel indicate field IDs. Dashed lines in panel (d) represent the exponential fit of the major and minor axis profiles. (g) Relative densities of MS/HeB and AGB stars with respect to RGB stars along the major axis.
Current usage metrics show cumulative count of Article Views (full-text article views including HTML views, PDF and ePub downloads, according to the available data) and Abstracts Views on Vision4Press platform.
Data correspond to usage on the plateform after 2015. The current usage metrics is available 48-96 hours after online publication and is updated daily on week days.
Initial download of the metrics may take a while.