Fig. A.3.
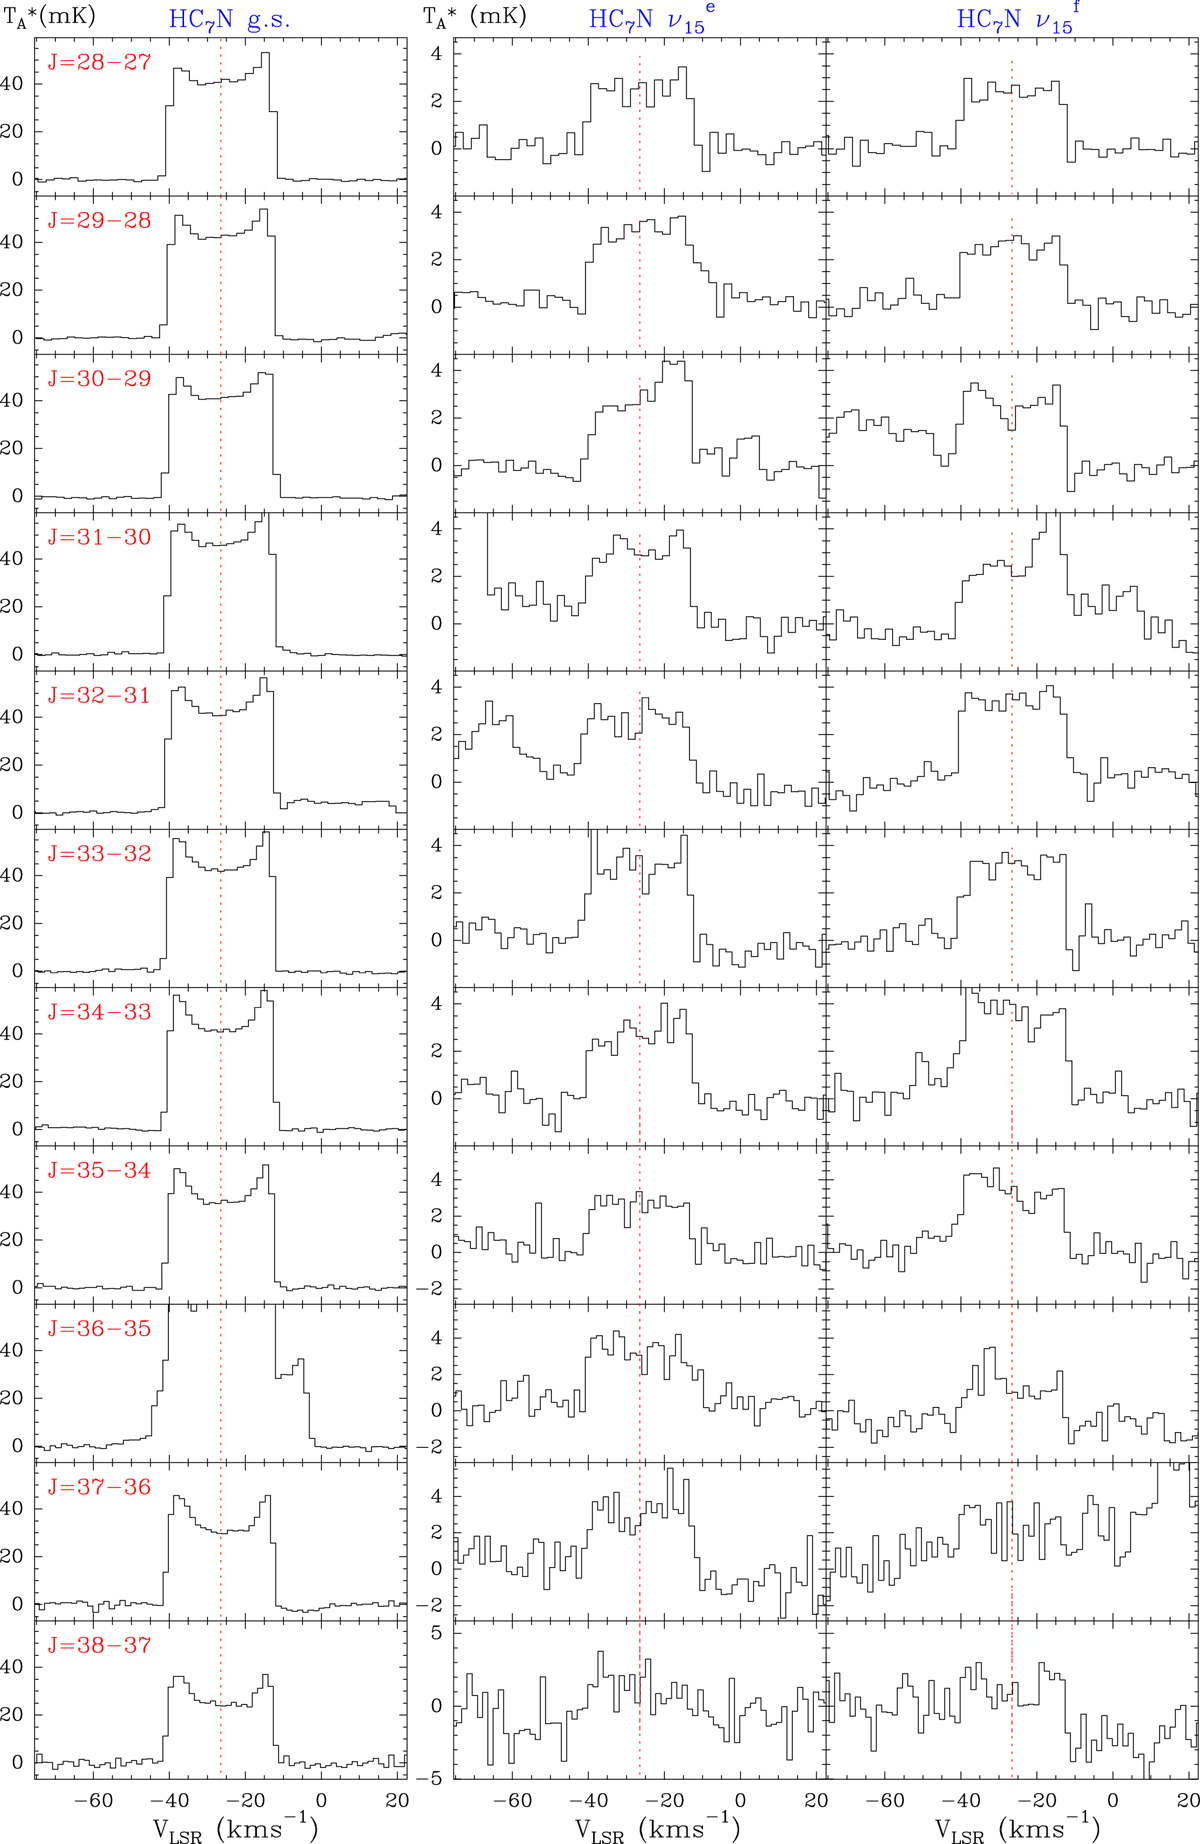
Observed lines of HC7N with the Yebes 40 m telescope. The rotational quantum numbers are indicated in the top-left side of each panel. The same transitions for the ν15 state are shown in the middle (e component) and right panels (f component). The intensity scale is antenna temperature in mK. The abscissa corresponds to LSR velocities in km s−1. The vertical red dotted line at −26.5 km s−1 indicates the systemic velocity of the envelope (Cernicharo et al. 2000, 2018).
Current usage metrics show cumulative count of Article Views (full-text article views including HTML views, PDF and ePub downloads, according to the available data) and Abstracts Views on Vision4Press platform.
Data correspond to usage on the plateform after 2015. The current usage metrics is available 48-96 hours after online publication and is updated daily on week days.
Initial download of the metrics may take a while.