Free Access
Fig. 5.
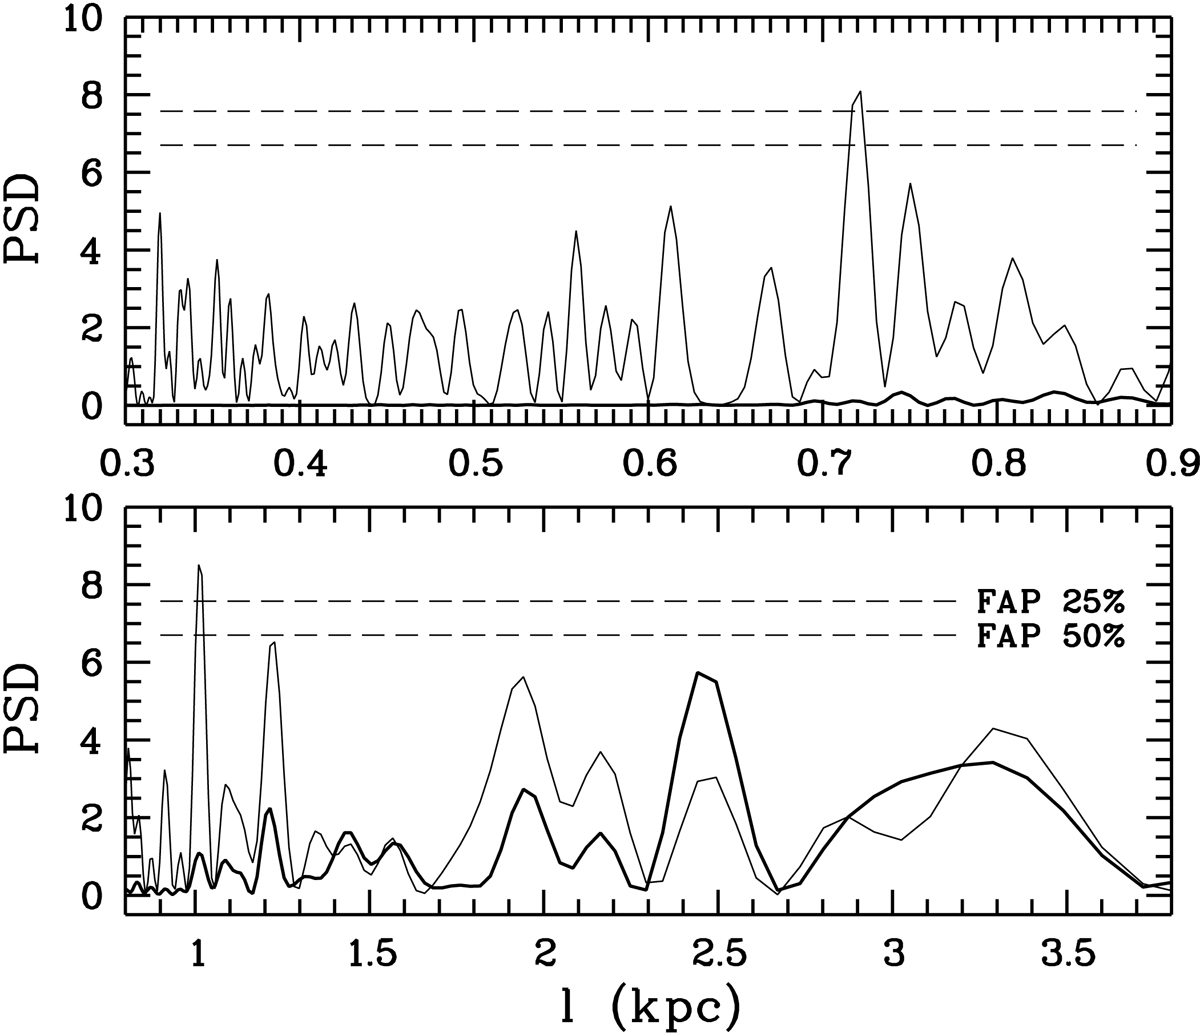
Normalized power spectral density of the U profile data from Fig. 2 (thick curves) and the function p(s) (thin curves) for the ring. Dashed lines are the FAP levels of 25 and 50%. See the text for more explanation.
Current usage metrics show cumulative count of Article Views (full-text article views including HTML views, PDF and ePub downloads, according to the available data) and Abstracts Views on Vision4Press platform.
Data correspond to usage on the plateform after 2015. The current usage metrics is available 48-96 hours after online publication and is updated daily on week days.
Initial download of the metrics may take a while.