Free Access
Fig. 4.
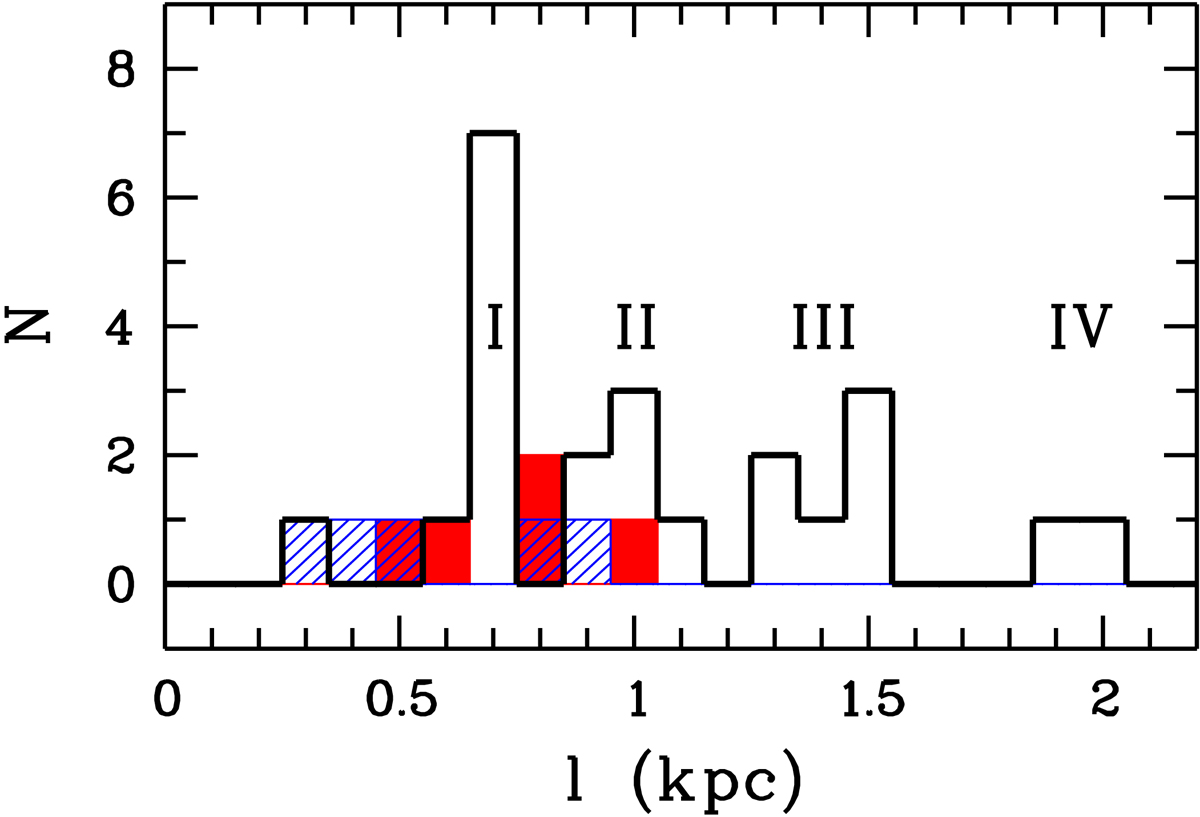
The number distribution histograms of local maxima of brightness by separation between adjacent objects along the ring (thick black line), Arm E (shaded in blue), and Arm W (filled red). Roman numerals denote subsets of the objects with close characteristic separations.
Current usage metrics show cumulative count of Article Views (full-text article views including HTML views, PDF and ePub downloads, according to the available data) and Abstracts Views on Vision4Press platform.
Data correspond to usage on the plateform after 2015. The current usage metrics is available 48-96 hours after online publication and is updated daily on week days.
Initial download of the metrics may take a while.