Fig. 4.
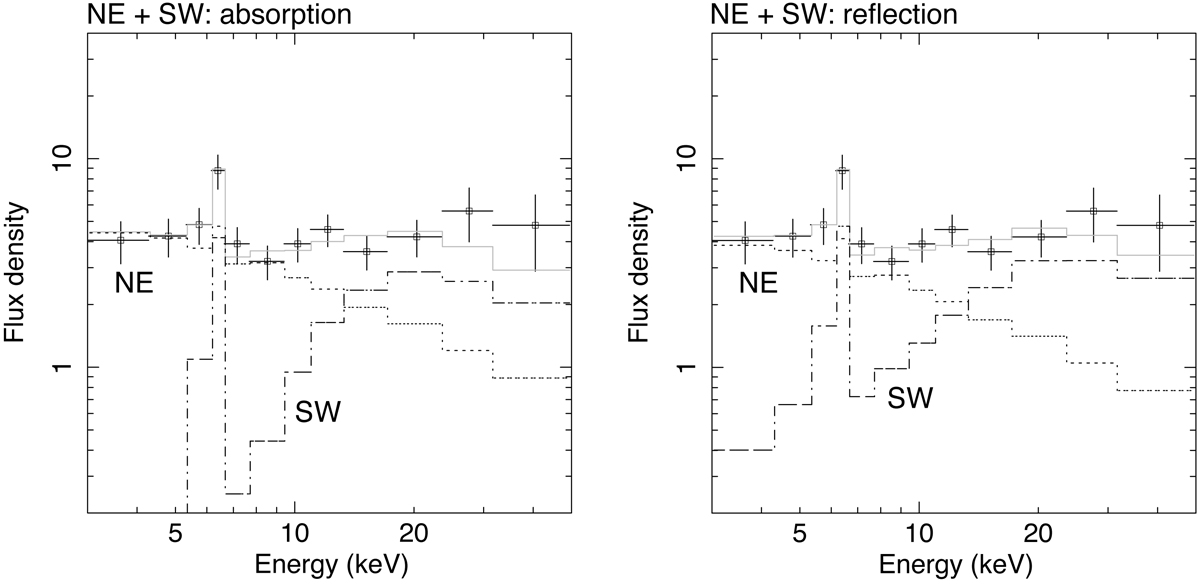
NuSTAR spectrum of Mrk 266 and the best-fitting two-component model (grey line). Left: SW-A; Right: SW-R. The contributions of the NE (dotted line) and SW (dash-dotted line) nuclei are overplotted. Same as in Fig. 2, the NuSTAR data used for the analysis were rebinned further for display purposes. Relative contributions of the NE and SW nuclei change dramatically across the energy range.
Current usage metrics show cumulative count of Article Views (full-text article views including HTML views, PDF and ePub downloads, according to the available data) and Abstracts Views on Vision4Press platform.
Data correspond to usage on the plateform after 2015. The current usage metrics is available 48-96 hours after online publication and is updated daily on week days.
Initial download of the metrics may take a while.