Fig. 6
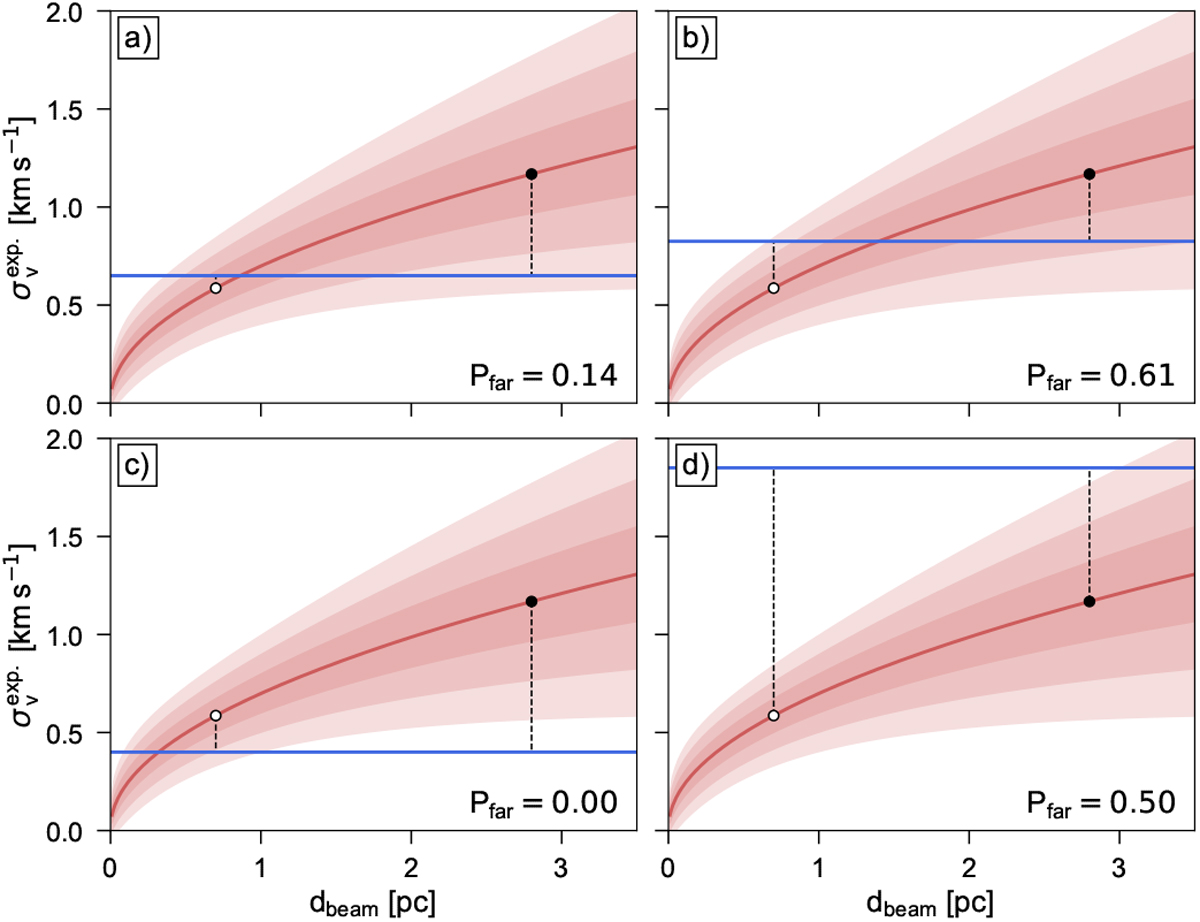
Illustration of the distance prior based on the fitted linewidth. The red line shows the size-linewidth relation from Solomon et al. (1987) corrected for the most recent distance estimates to the Galactic centre. Red-shaded areas show the
![]() ,
,
![]() , and
, and ![]() intervals determined from variations of the parameters of the size-linewidth relation. The two dots show expected velocity dispersion values for corresponding physical extents of the beam for the near (white dot) and far (black dot) kinematic distance solutions. Blue horizontal lines show velocity dispersion values of fit components and dashed vertical lines indicate the relevant distances to the expected values, from which the
intervals determined from variations of the parameters of the size-linewidth relation. The two dots show expected velocity dispersion values for corresponding physical extents of the beam for the near (white dot) and far (black dot) kinematic distance solutions. Blue horizontal lines show velocity dispersion values of fit components and dashed vertical lines indicate the relevant distances to the expected values, from which the
![]() prior is determined. See Sect. 3.3 for more details.
prior is determined. See Sect. 3.3 for more details.
Current usage metrics show cumulative count of Article Views (full-text article views including HTML views, PDF and ePub downloads, according to the available data) and Abstracts Views on Vision4Press platform.
Data correspond to usage on the plateform after 2015. The current usage metrics is available 48-96 hours after online publication and is updated daily on week days.
Initial download of the metrics may take a while.