Fig. 4
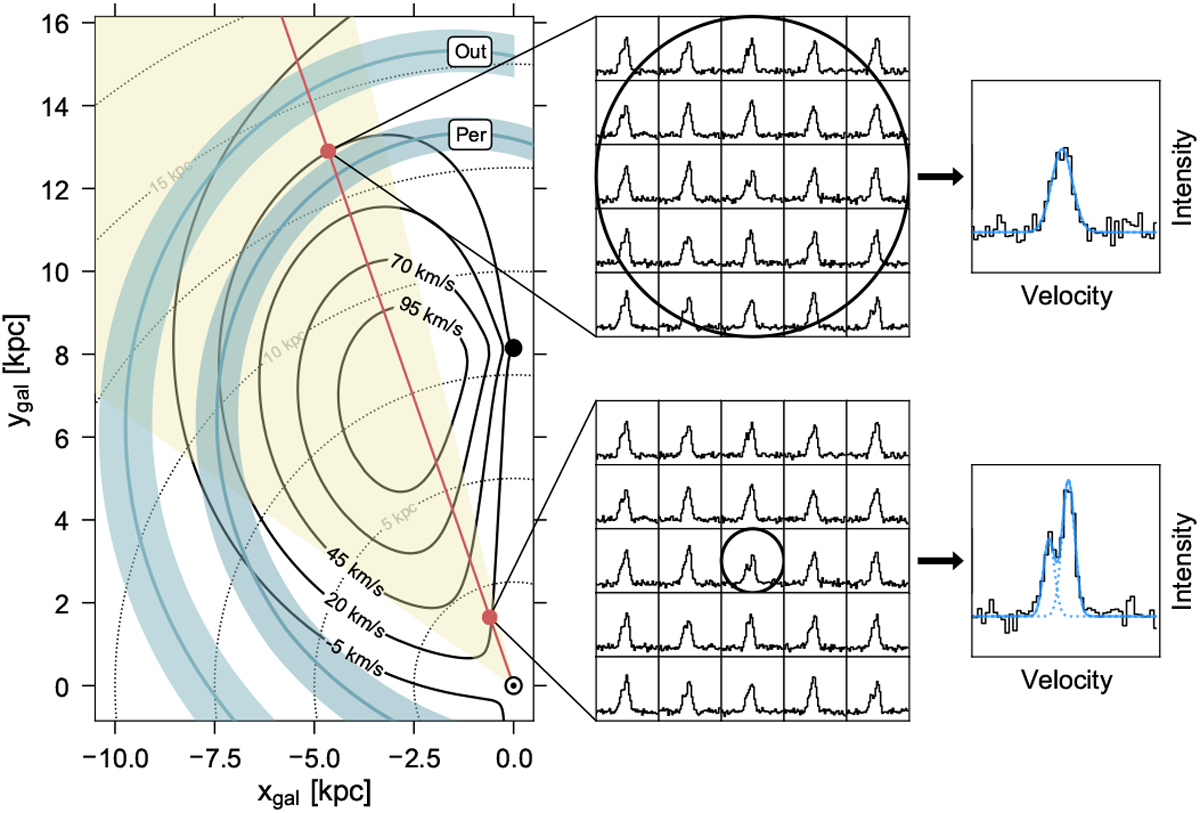
Illustration of linewidth broadening caused by beam averaging. Left panel: same as the left panel of Fig. 1, but showing only the positions and estimated widths of the Perseus (Per) and Outer (Out) spiral arms. Black solid lines show curves of constant projected vLSR values. The red line shows a random line of sight with the corresponding intersections with the vLSR = 20 km s−1 curve indicated with red dots. The centre panels illustrate the change in spatial extent of the beam (black circle) for a region with two blended velocity components embedded at the near (bottom centre) and far (top centre) distance. The right panels illustrate the resulting observed spectra (black line) and Gaussian fit components (blue lines).
Current usage metrics show cumulative count of Article Views (full-text article views including HTML views, PDF and ePub downloads, according to the available data) and Abstracts Views on Vision4Press platform.
Data correspond to usage on the plateform after 2015. The current usage metrics is available 48-96 hours after online publication and is updated daily on week days.
Initial download of the metrics may take a while.