Fig. C.6
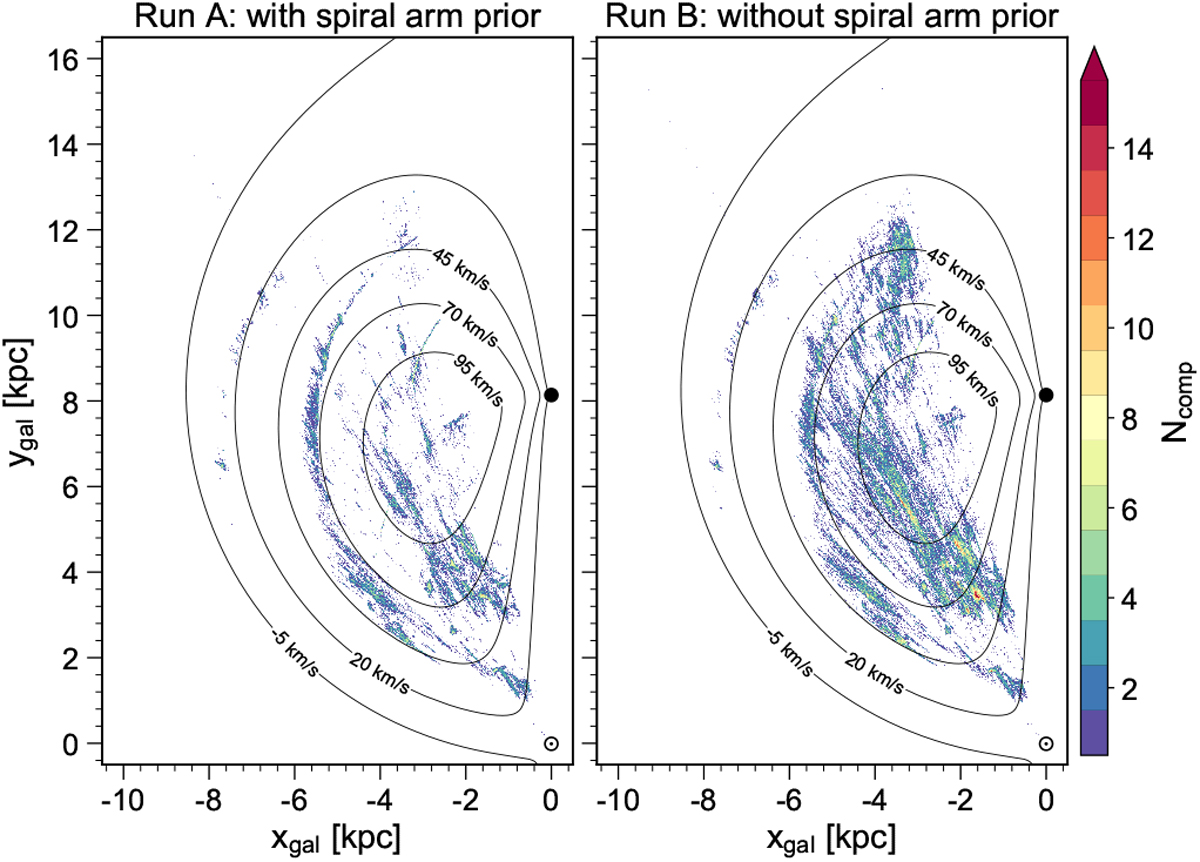
Face-on view of the number of components with distance results that cause an absolute vLSR deviation of more than 10 km s−1 compared to the Galactic rotation curve model for the BDC results obtained with (left) and without (right) the spiral arm prior. The values are binned in 10 × 10 pc cells and the values were summed up along the zgal axis. The position of the Sun and Galactic centre are indicated by the Sun symbol and black dot, respectively. When displayed in Adobe Acrobat, it is possible to show the spiral arm positions, hide the curves of constant projected vLSR, and show the grid.
Current usage metrics show cumulative count of Article Views (full-text article views including HTML views, PDF and ePub downloads, according to the available data) and Abstracts Views on Vision4Press platform.
Data correspond to usage on the plateform after 2015. The current usage metrics is available 48-96 hours after online publication and is updated daily on week days.
Initial download of the metrics may take a while.