Fig. 3
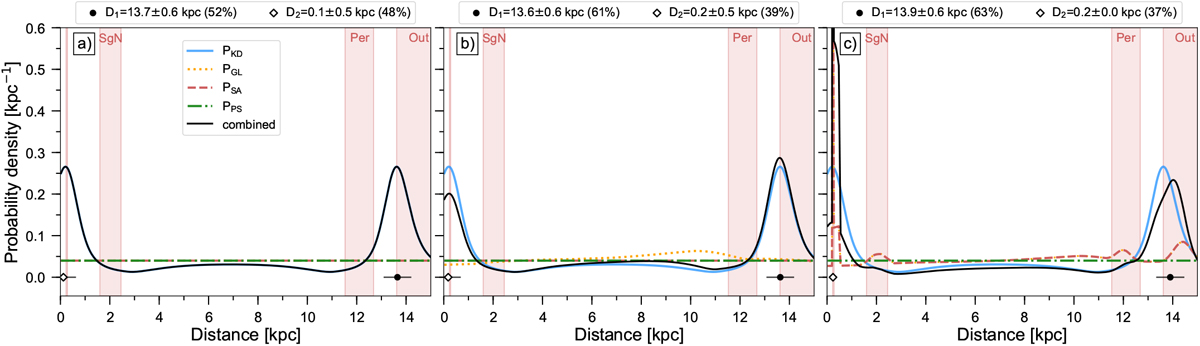
BDC examples for a source located at ℓ = 32°, b = 0°, and vLSR = 5 km s−1, illustrating how sources with low vLSR velocities are biased towards the far distance solution. The panels show BDC results using the KD and PS priors (a), in addition to the GL (b) as well as the SA priors (c). The meaning of the lines and symbols is the same as in Fig. 2.
Current usage metrics show cumulative count of Article Views (full-text article views including HTML views, PDF and ePub downloads, according to the available data) and Abstracts Views on Vision4Press platform.
Data correspond to usage on the plateform after 2015. The current usage metrics is available 48-96 hours after online publication and is updated daily on week days.
Initial download of the metrics may take a while.