Fig. A.3
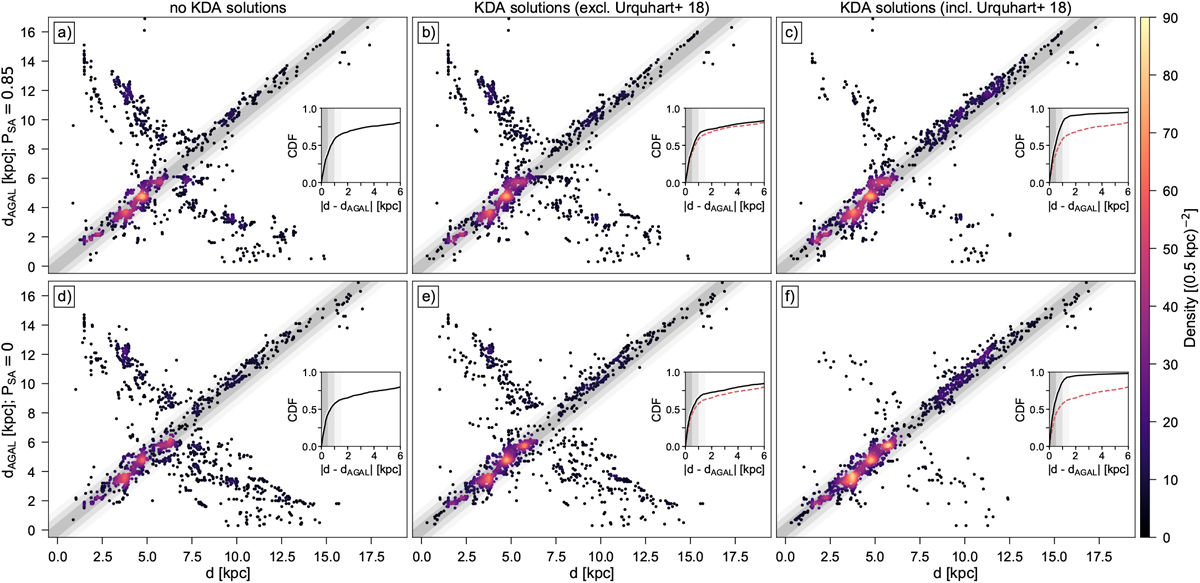
BDC results for the ATLASGAL clump sample plotted against their literature values (dAGAL). The six panels correspond to different settings for the spiral arm and KDA priors. The points are colour-coded by their density. The insets show the cumulative distribution functions (CDFs) for the difference between the BDC results and the literature distances of the respective panels. The red dashed line in the insets of panels b and c and panels e and f correspond to the CDFs of panel a and d, respectively. The grey-shaded areas in the main panels and insets correspond to |d − dAGAL| intervals of 0.5, 1.0, and 1.5 kpc. See Appendix A.4 for more details.
Current usage metrics show cumulative count of Article Views (full-text article views including HTML views, PDF and ePub downloads, according to the available data) and Abstracts Views on Vision4Press platform.
Data correspond to usage on the plateform after 2015. The current usage metrics is available 48-96 hours after online publication and is updated daily on week days.
Initial download of the metrics may take a while.