Fig. A.2
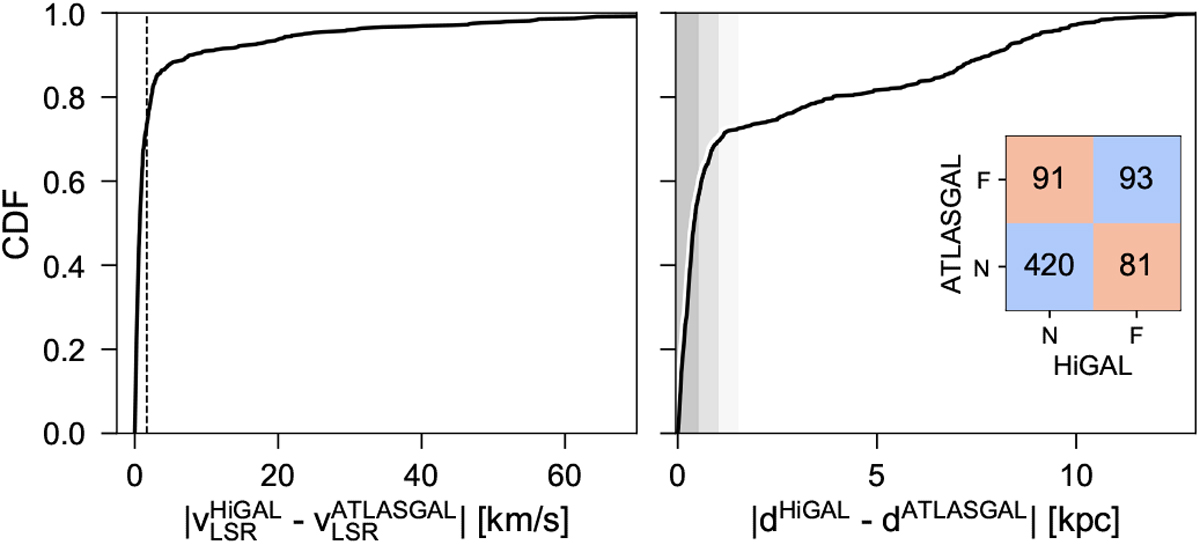
Comparison between 685 associated Hi-GAL and ATLASGAL sources (Urquhart et al. 2018). Left: CDF of the absolute difference between the inferred and measured vLSR velocities for the Hi-GAL and ATLASGAL catalogues, respectively. The dashed vertical line indicates the assumed linewidth for the Hi-GAL sources. Right: CDF of the absolute difference of reported distances for Hi-GAL and associated ATLASGAL sources. The vertical grey areas indicate distance bins of 0.5 kpc. The inset shows the corresponding confusion matrix for the KDA resolution.
Current usage metrics show cumulative count of Article Views (full-text article views including HTML views, PDF and ePub downloads, according to the available data) and Abstracts Views on Vision4Press platform.
Data correspond to usage on the plateform after 2015. The current usage metrics is available 48-96 hours after online publication and is updated daily on week days.
Initial download of the metrics may take a while.