Fig. 21
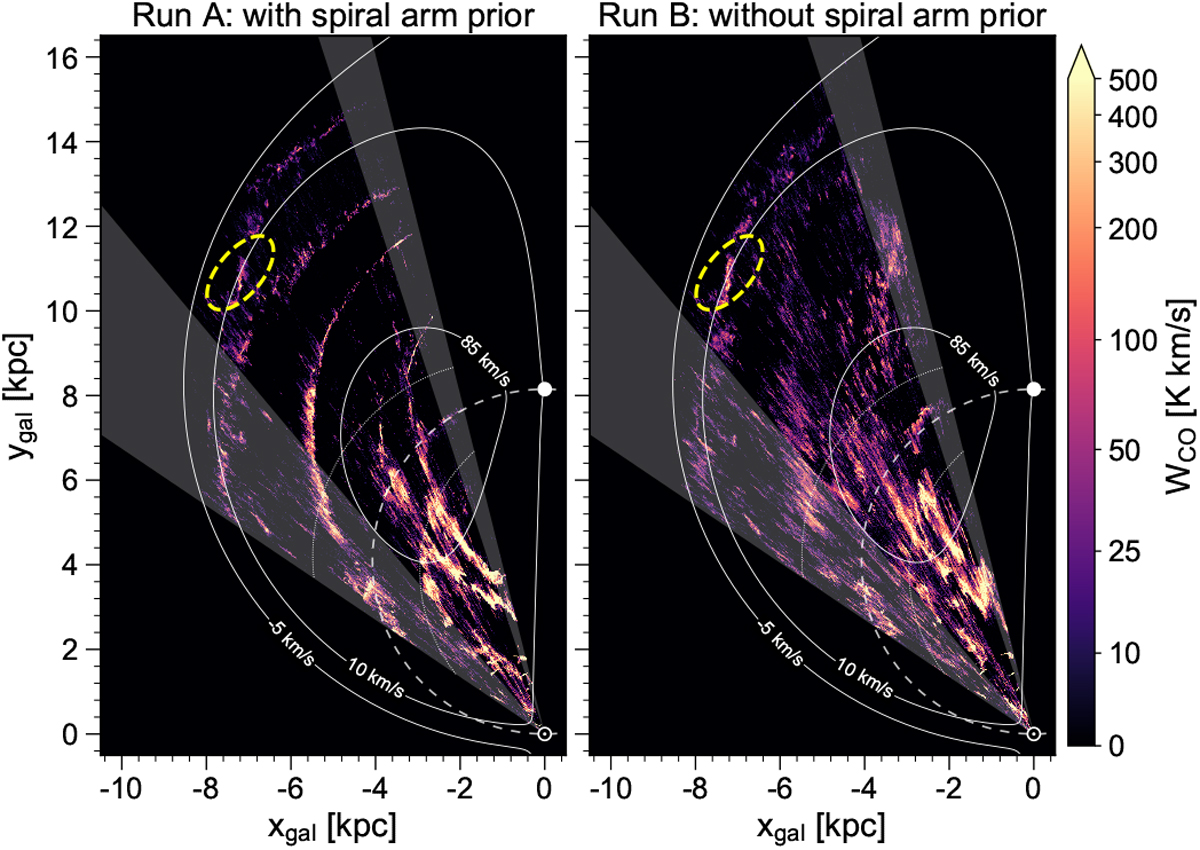
Same as Fig. 8, but overplotted with diagnostics to illustrate potential issues in the distance assignment. The position of the Sun and the Galactic centre are indicated with a Sun symbol and a white dot, respectively. Solid white curves show constant projected vLSR velocities. The dashed white curve marks the locus of tangent points and dotted lines indicate the area where vLSR values are within 10 km s−1 of the tangent point velocity. Shaded areas show GRS regions that either had limited latitude or velocity coverage. The yellow dashed ellipse indicates a likely artefact of nearby emission that was erroneously placed at far distances. See Sect. 4.8 for more details.
Current usage metrics show cumulative count of Article Views (full-text article views including HTML views, PDF and ePub downloads, according to the available data) and Abstracts Views on Vision4Press platform.
Data correspond to usage on the plateform after 2015. The current usage metrics is available 48-96 hours after online publication and is updated daily on week days.
Initial download of the metrics may take a while.