Fig. 18
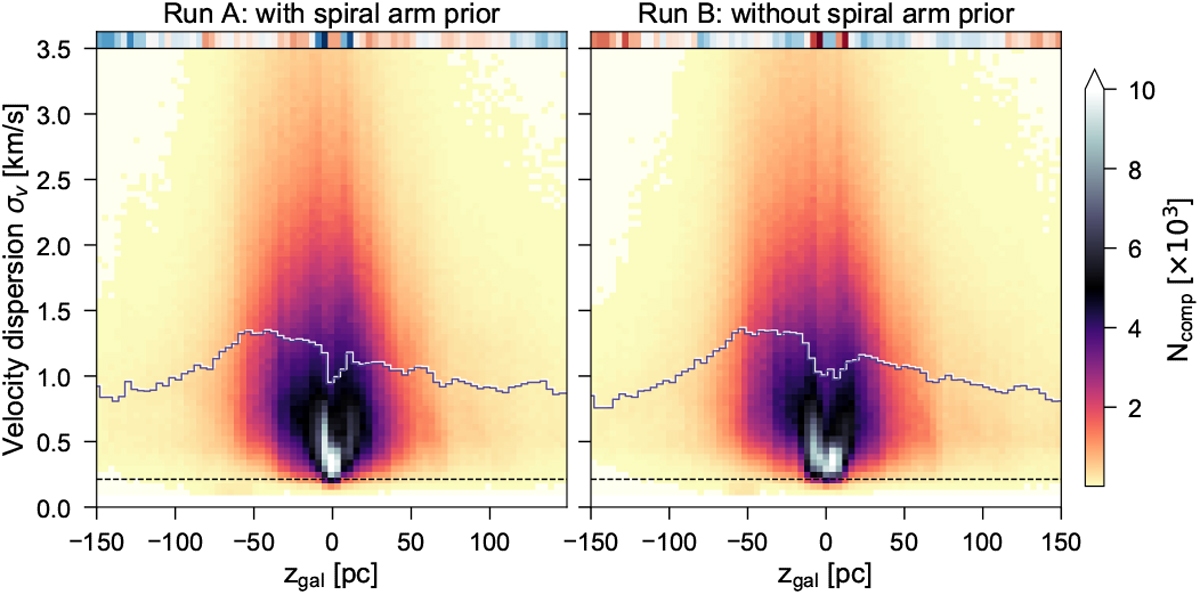
2D histograms of velocity dispersion and estimated vertical distances zgal for the BDC run with (left) and without (right) the spiral arm prior. The blue line shows the median σv value per zgal bin. The small strips at the top of the individual panels show where the median value is higher (blue) or lower (red) compared to the opposite BDC run, with the strength of the colour corresponding to the magnitude of the difference. The dashed horizontal line indicates the GRS velocity resolution (0.21 km s−1).
Current usage metrics show cumulative count of Article Views (full-text article views including HTML views, PDF and ePub downloads, according to the available data) and Abstracts Views on Vision4Press platform.
Data correspond to usage on the plateform after 2015. The current usage metrics is available 48-96 hours after online publication and is updated daily on week days.
Initial download of the metrics may take a while.