Fig. 17
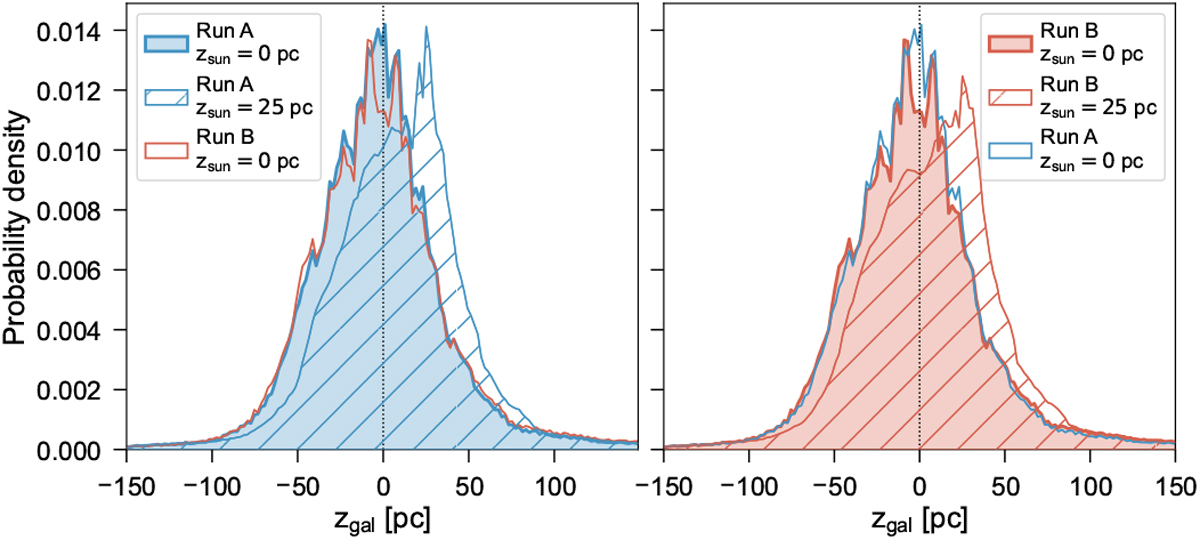
PDFs of the vertical distribution of the 13CO emission for the entire GRS data set. Shaded PDFs are for the BDC runs with (left) and without (right) the SA prior, and unfilled PDFs show the distribution of the opposite panel for reference. Hatched PDFs show the zgal distribution assuming an offset of the Sun above the midplane of zoffset = 25 pc.
Current usage metrics show cumulative count of Article Views (full-text article views including HTML views, PDF and ePub downloads, according to the available data) and Abstracts Views on Vision4Press platform.
Data correspond to usage on the plateform after 2015. The current usage metrics is available 48-96 hours after online publication and is updated daily on week days.
Initial download of the metrics may take a while.