Fig. 15
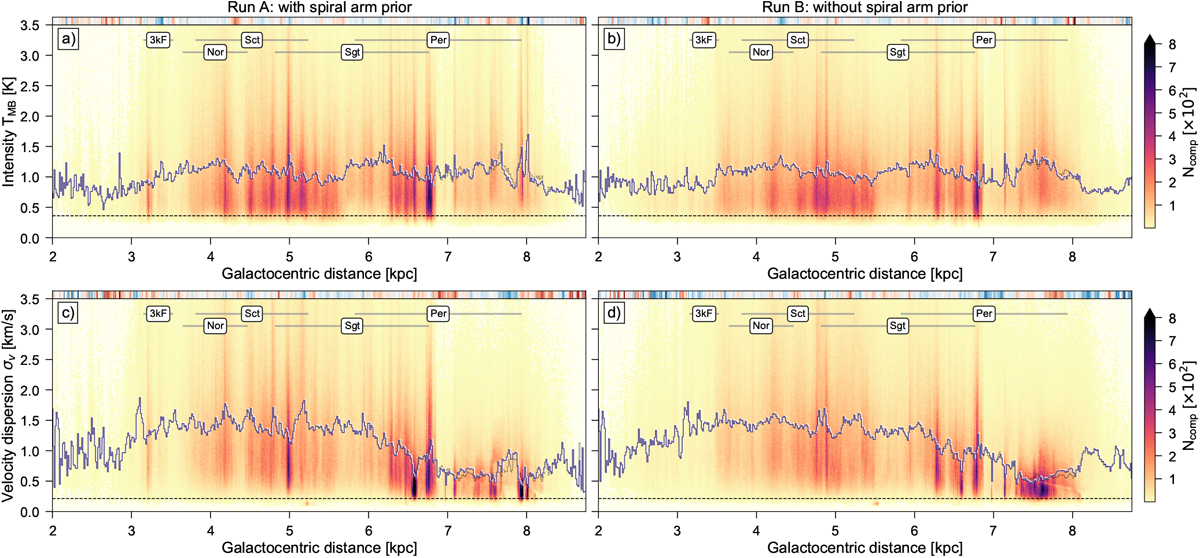
2D histograms of estimated Galactocentric distance values and intensity (top) and velocity dispersion (bottom) values for the BDC run with (left column) and without (right column) the spiral arm prior. The blue lines show the respective median values per distance bin and dotted black lines give the corresponding values for distances obtained without the size-linewidth prior. The small strips at the top of the individual panels show where the median value is higher (blue) or lower (red) compared to the opposite BDC run, with the strength of the colour corresponding to the magnitude of the difference. The grey horizontal lines in all panels show the approximate Rgal extent of five spiral arms overlapping with the GRS coverage. The dashed horizontal line in the top panels at TMB = 0.36 K corresponds to the 3× S/N limit forthe 0.1st percentile of the GRS noise distribution (see Riener et al. 2020). The dashed horizontal line in the bottom panels indicates the velocity resolution of the GRS (0.21 km s−1).
Current usage metrics show cumulative count of Article Views (full-text article views including HTML views, PDF and ePub downloads, according to the available data) and Abstracts Views on Vision4Press platform.
Data correspond to usage on the plateform after 2015. The current usage metrics is available 48-96 hours after online publication and is updated daily on week days.
Initial download of the metrics may take a while.