Fig. 7.
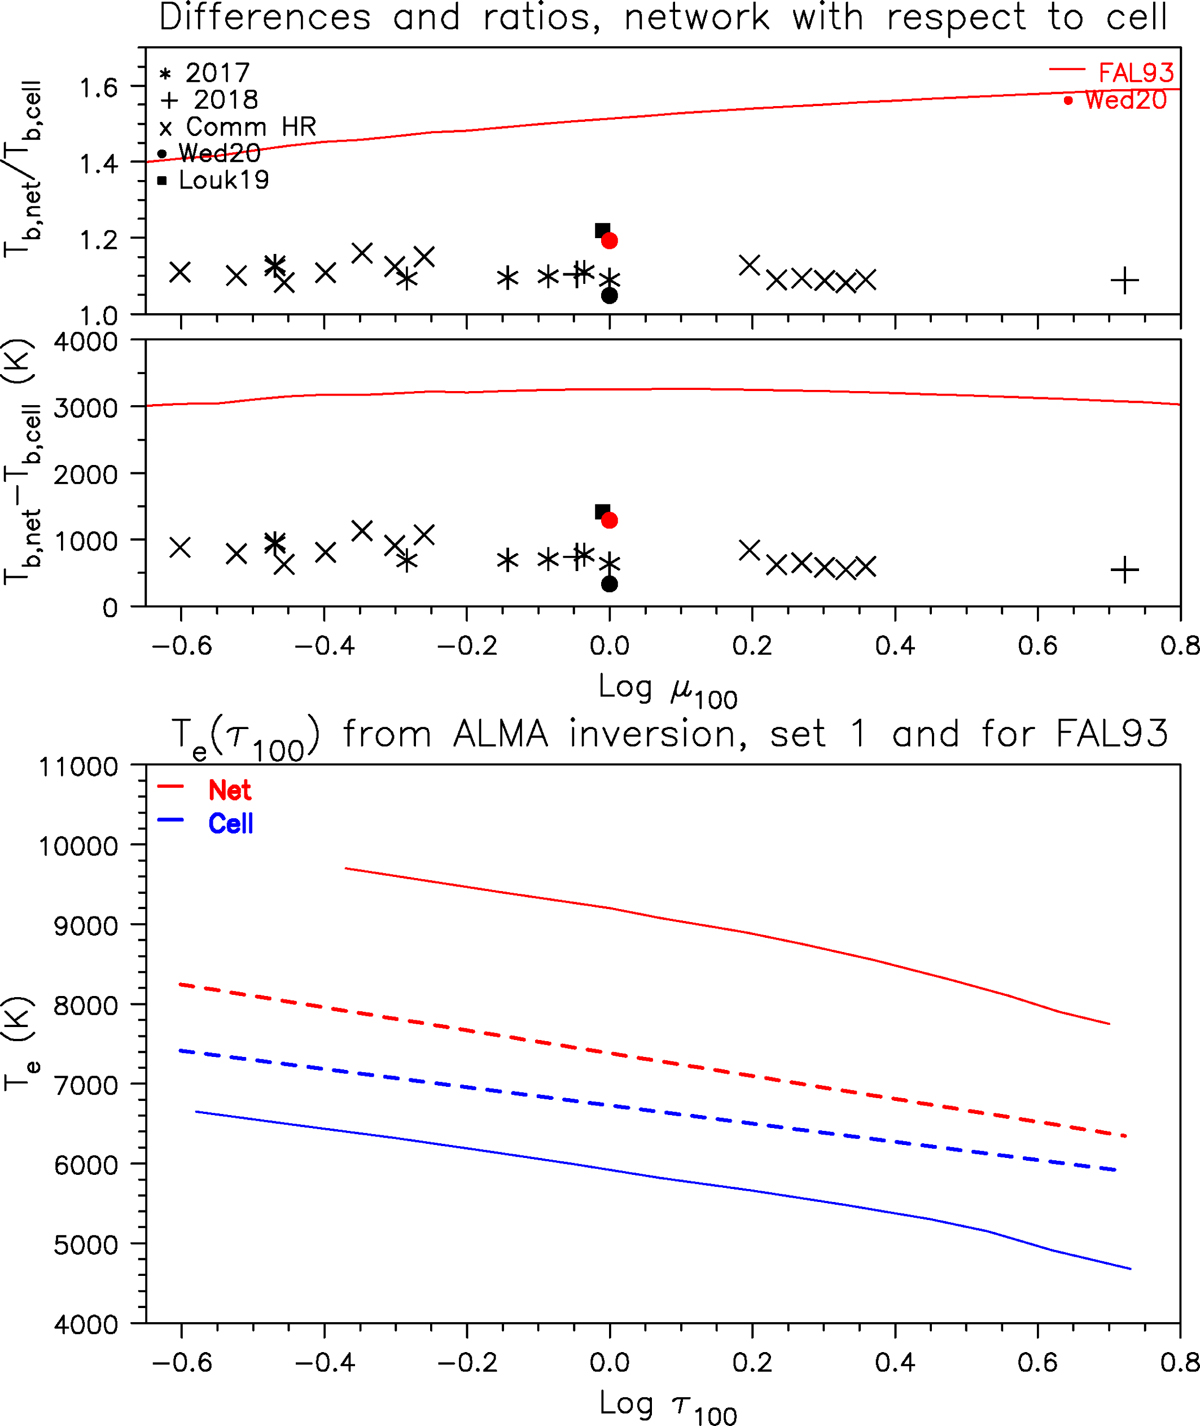
Top: Tb differences and ratios between network and cell as a function of reference μ. The symbols have the same meaning as in Fig. 6. The red full lines show the predictions of the FAL93 models. Bottom: the thick dashed lines indicate the electron temperature as a function of reference τ from the inversion of the observations for the cell interior (blue) and for the network (red); the thin full lines show the FAL93 models A and F.
Current usage metrics show cumulative count of Article Views (full-text article views including HTML views, PDF and ePub downloads, according to the available data) and Abstracts Views on Vision4Press platform.
Data correspond to usage on the plateform after 2015. The current usage metrics is available 48-96 hours after online publication and is updated daily on week days.
Initial download of the metrics may take a while.