Fig. 6.
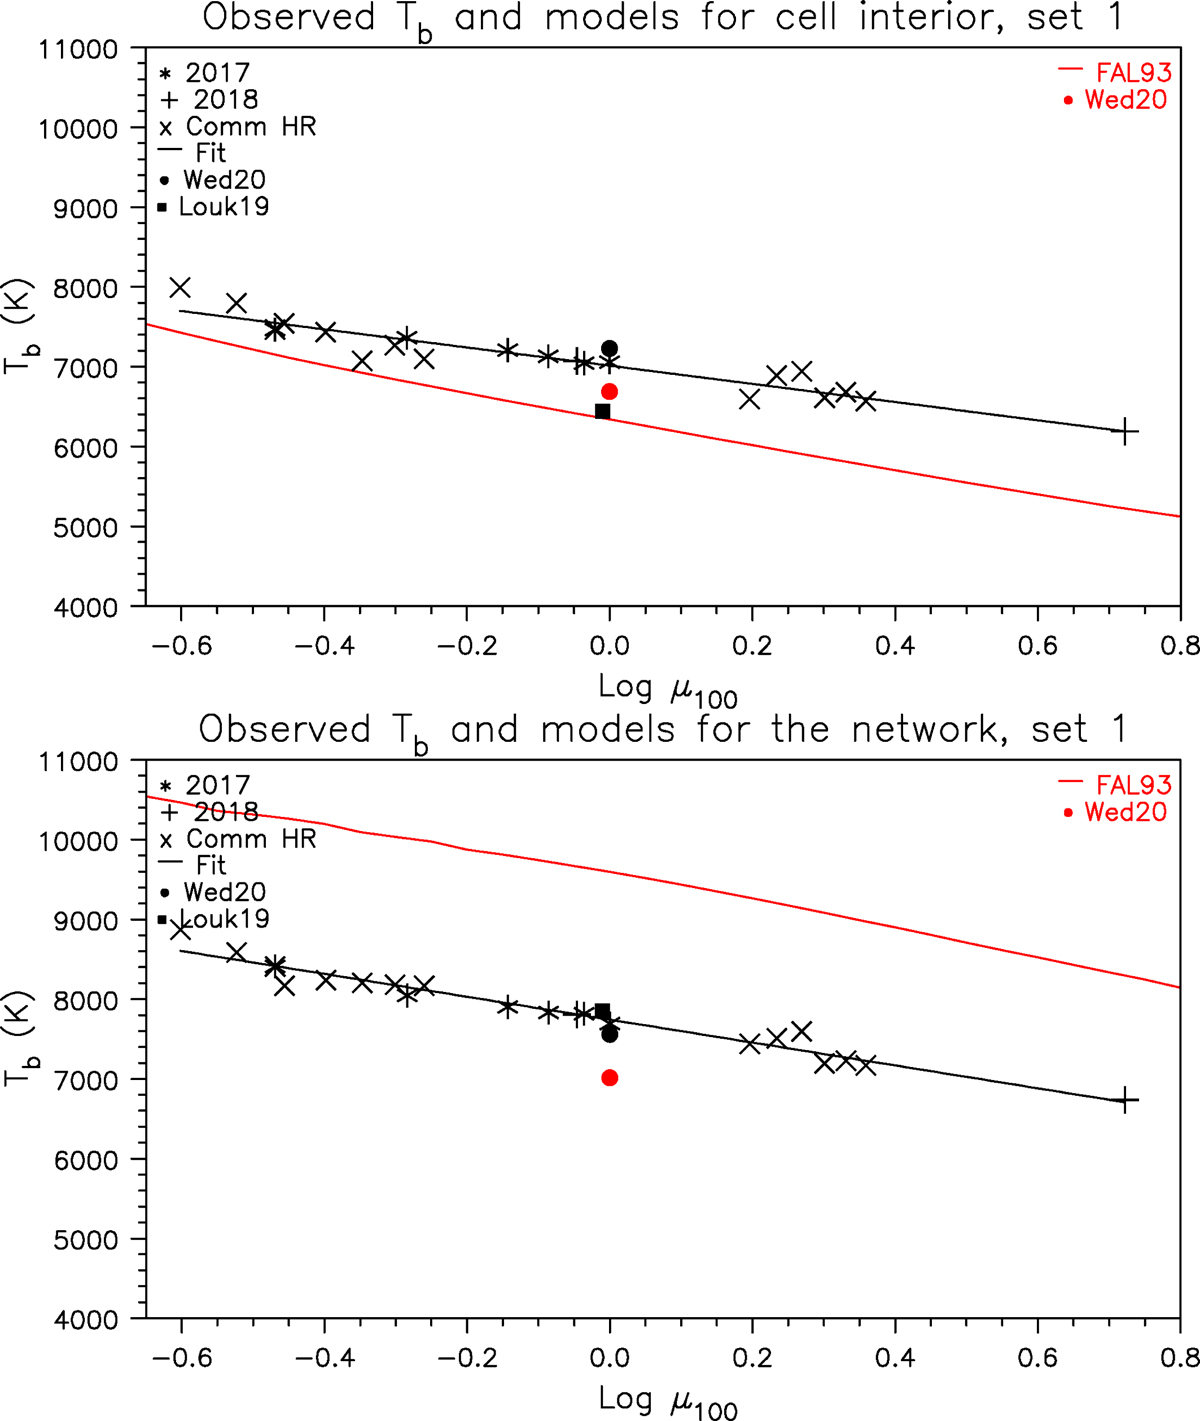
Brightness temperature as a function of reference μ for the cell interior (top) and for the network (bottom) for measurement set 1. Different symbols denote different data sets, from commissioning mosaics, from March 16, 2017 and April 12, 2018. The black line indicates the result of linear regression. Values from Loukitcheva et al. (2019, Louk19) and from Wedemeyer et al. (2020, Wed20) are also plotted for reference. The red full lines show the FAL93 models A (top) and F (bottom). The red filled circle is from the rMHD model of Wedemeyer et al. (2020).
Current usage metrics show cumulative count of Article Views (full-text article views including HTML views, PDF and ePub downloads, according to the available data) and Abstracts Views on Vision4Press platform.
Data correspond to usage on the plateform after 2015. The current usage metrics is available 48-96 hours after online publication and is updated daily on week days.
Initial download of the metrics may take a while.