Fig. 4.
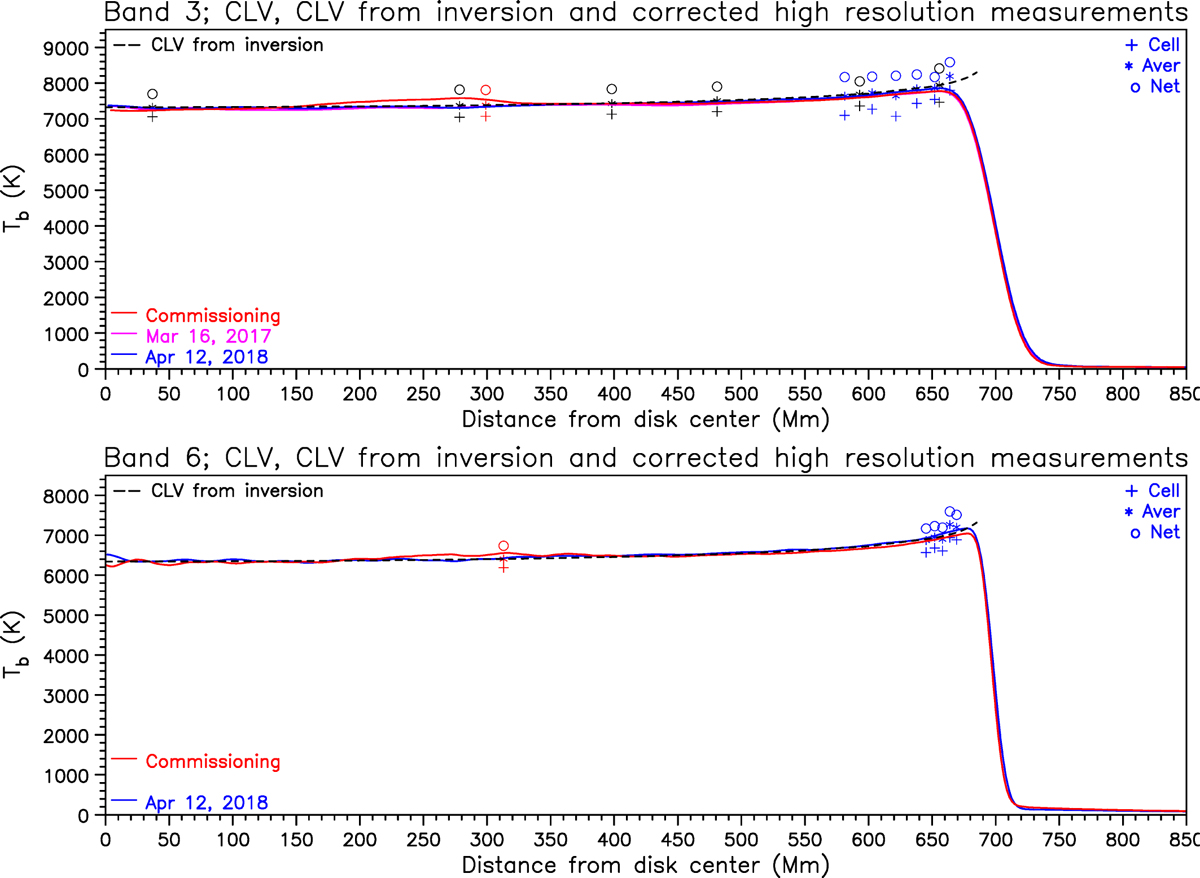
Corrected brightness for cell/average/network for Bands 3 and 6 from HR images, as a function of distance from the center of the disk, overplotted on the corresponding CLV curves and the CLV curve derived from the inversion (dashed line). Magenta indicates the March 2017 data, blue is for April 2018 and red for commissioning.
Current usage metrics show cumulative count of Article Views (full-text article views including HTML views, PDF and ePub downloads, according to the available data) and Abstracts Views on Vision4Press platform.
Data correspond to usage on the plateform after 2015. The current usage metrics is available 48-96 hours after online publication and is updated daily on week days.
Initial download of the metrics may take a while.