Fig. 1.
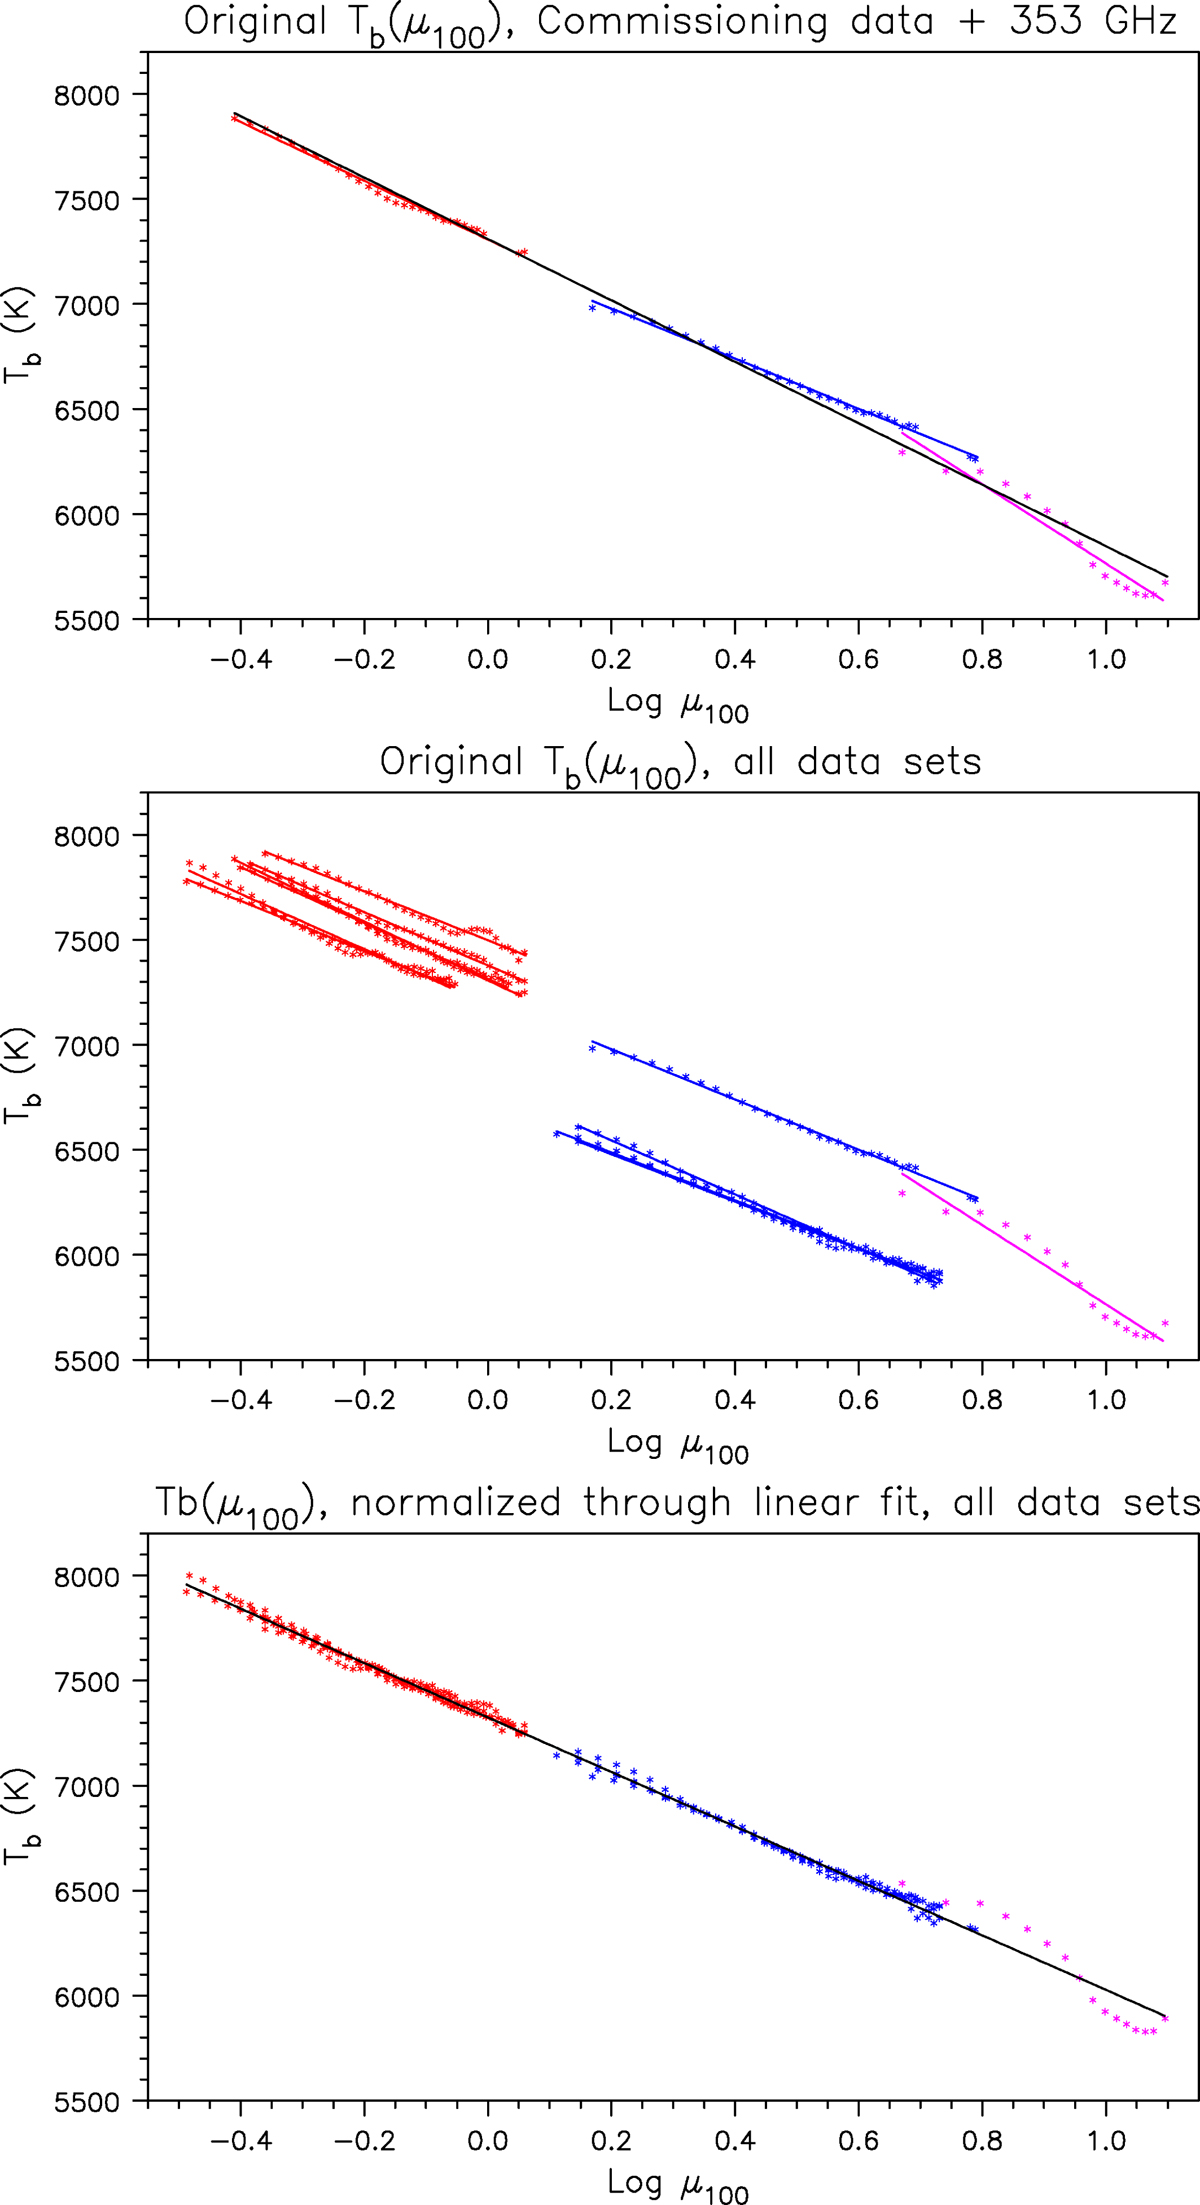
Top: original brightness as a function of reference μ (μ100 = μobs (fobs/100 GHz)2) for commissioning and 353 GHz data only (red for Band 3, blue for Band 6, and magenta for 353 GHz). Middle: original brightness for all data sets. Bottom: normalized brightness for all data sets. Colored lines indicate linear fits to individual bands; black lines indicate fits to all data points.
Current usage metrics show cumulative count of Article Views (full-text article views including HTML views, PDF and ePub downloads, according to the available data) and Abstracts Views on Vision4Press platform.
Data correspond to usage on the plateform after 2015. The current usage metrics is available 48-96 hours after online publication and is updated daily on week days.
Initial download of the metrics may take a while.