Fig. 2.
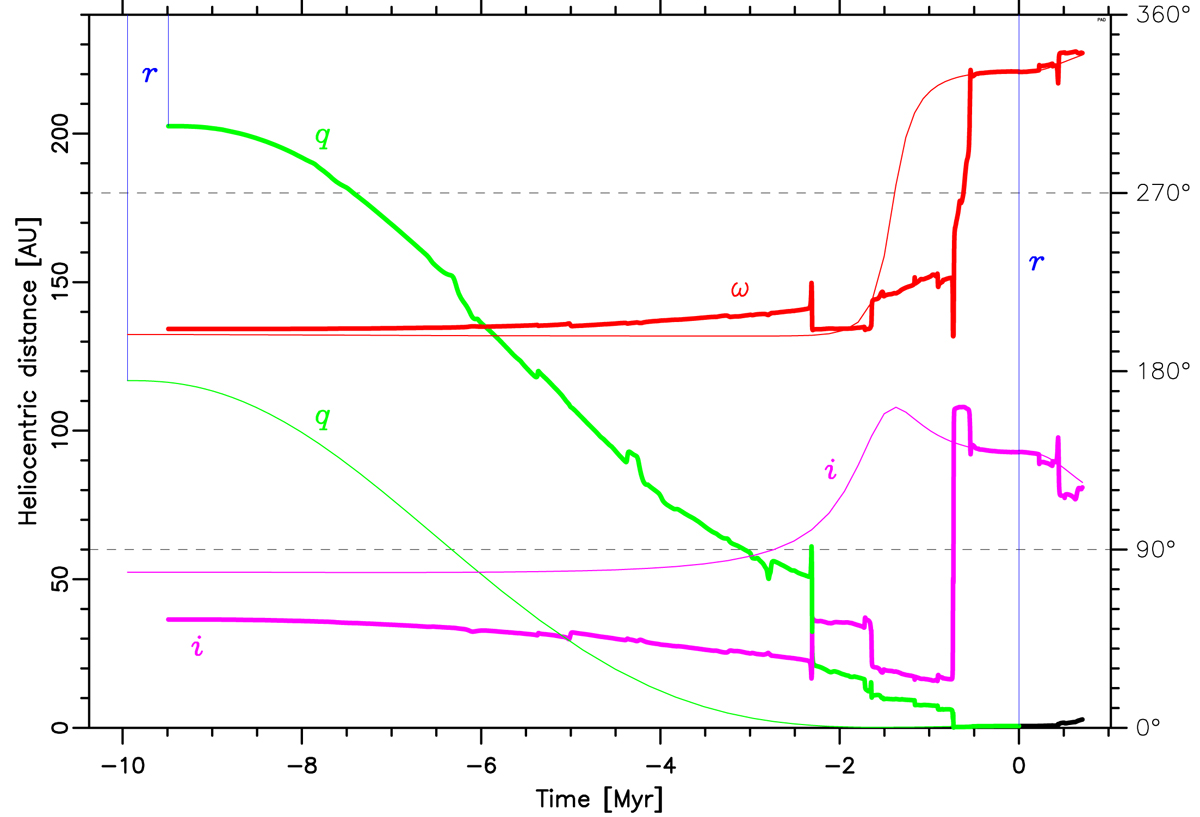
Dynamical evolution of the nominal orbit of C/2002 T7 LINEAR (d6 solution) under the simultaneous Galactic and stellar perturbations. The left vertical axis describes a heliocentric distance plot (thin blue lines) and a perihelion distance (green lines that turn black if e ≥ 1.0). The right vertical axis describes the angular elements (with respect to the Galactic disc plane): an inclination (fuchsia line) and an argument of perihelion (red line). Thin lines describe the dynamics when all stellar perturbations are omitted.
Current usage metrics show cumulative count of Article Views (full-text article views including HTML views, PDF and ePub downloads, according to the available data) and Abstracts Views on Vision4Press platform.
Data correspond to usage on the plateform after 2015. The current usage metrics is available 48-96 hours after online publication and is updated daily on week days.
Initial download of the metrics may take a while.