Open Access
Fig. C.1
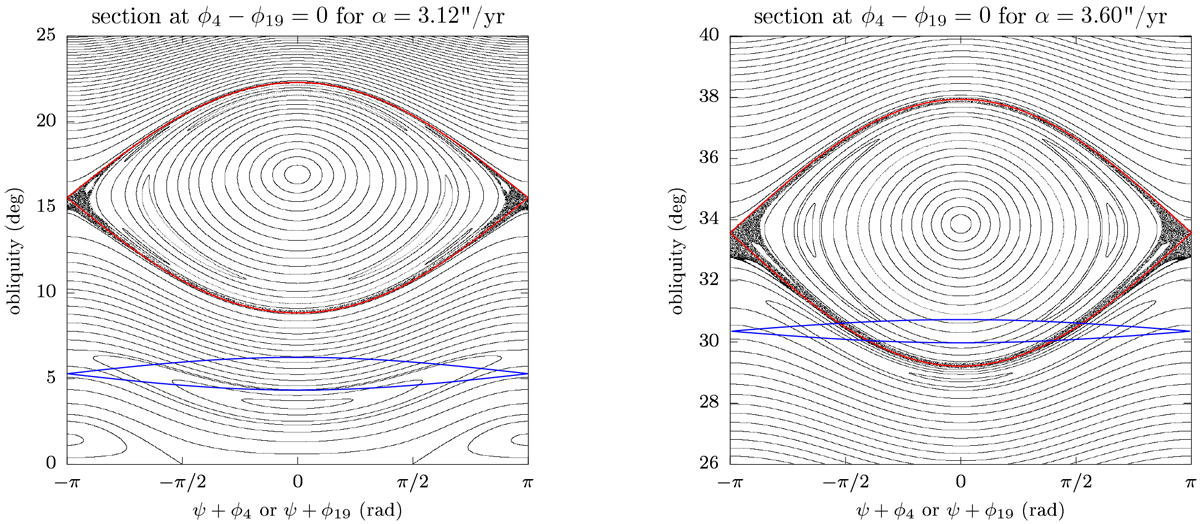
Poincaré surfaces of section showing the dynamics in the vicinity of resonances with ϕ4 and ϕ19. Each graph corresponds to a different value of α (see titles). The separatrices of the two resonances taken separately are shown with coloured curves: red for ϕ4 and blue for ϕ19.
Current usage metrics show cumulative count of Article Views (full-text article views including HTML views, PDF and ePub downloads, according to the available data) and Abstracts Views on Vision4Press platform.
Data correspond to usage on the plateform after 2015. The current usage metrics is available 48-96 hours after online publication and is updated daily on week days.
Initial download of the metrics may take a while.