Fig. 4.
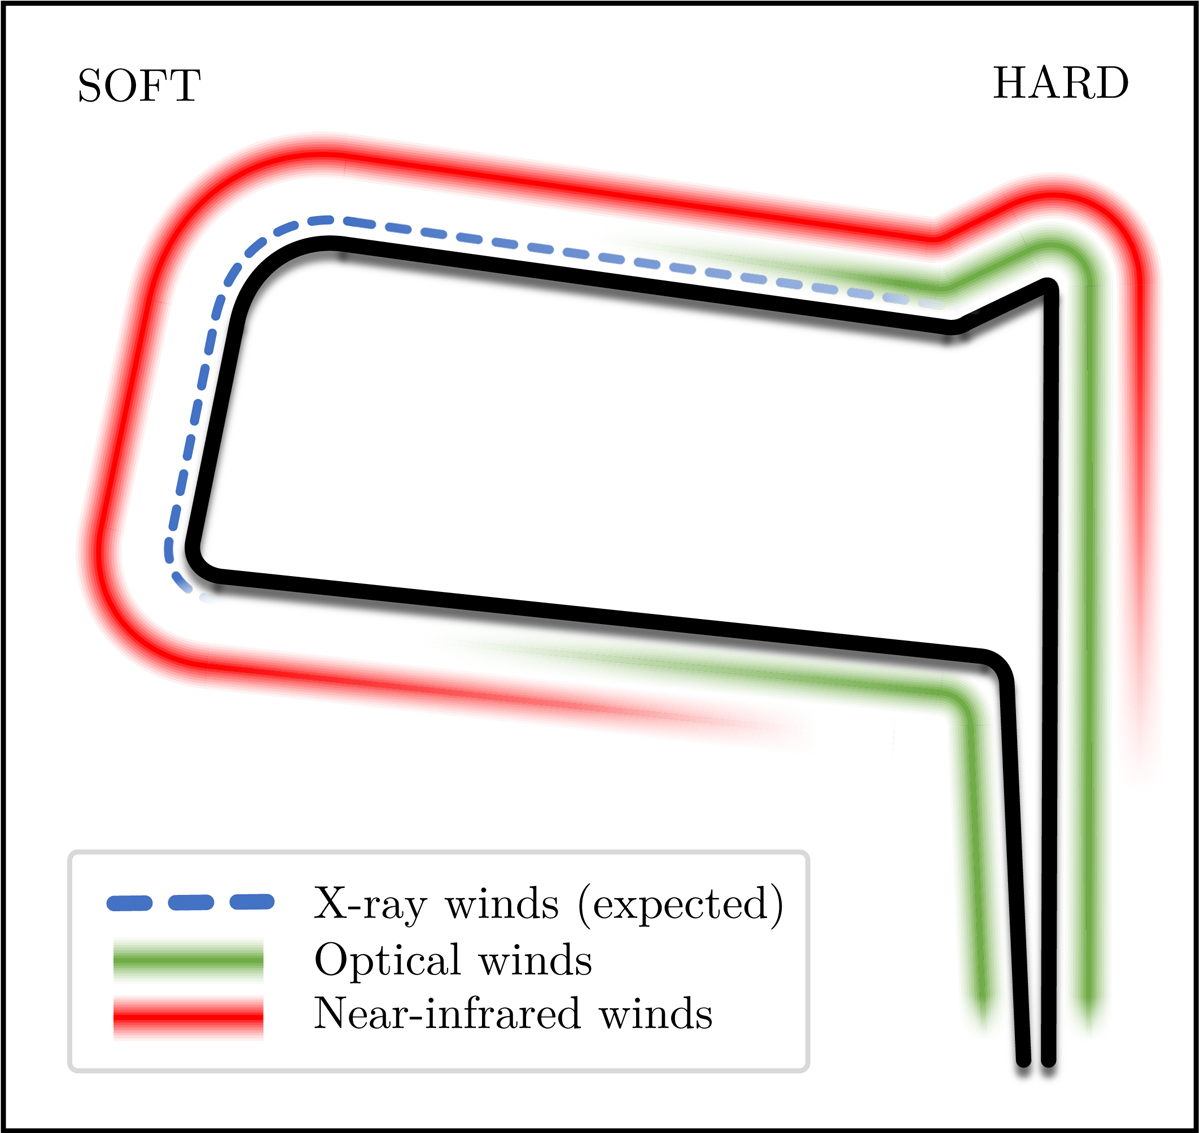
Sketch of the wind visibility across the hardness-intensity diagram of MAXI J1820+070 (based on MD19 and this work). The blurred lines indicate the (approximate) location of the wind detections at optical and NIR wavelengths. The outburst stages that are more favourable for detecting X-ray winds (based on Ponti et al. 2012) are marked by a dashed blue line.
Current usage metrics show cumulative count of Article Views (full-text article views including HTML views, PDF and ePub downloads, according to the available data) and Abstracts Views on Vision4Press platform.
Data correspond to usage on the plateform after 2015. The current usage metrics is available 48-96 hours after online publication and is updated daily on week days.
Initial download of the metrics may take a while.