Fig. 3.
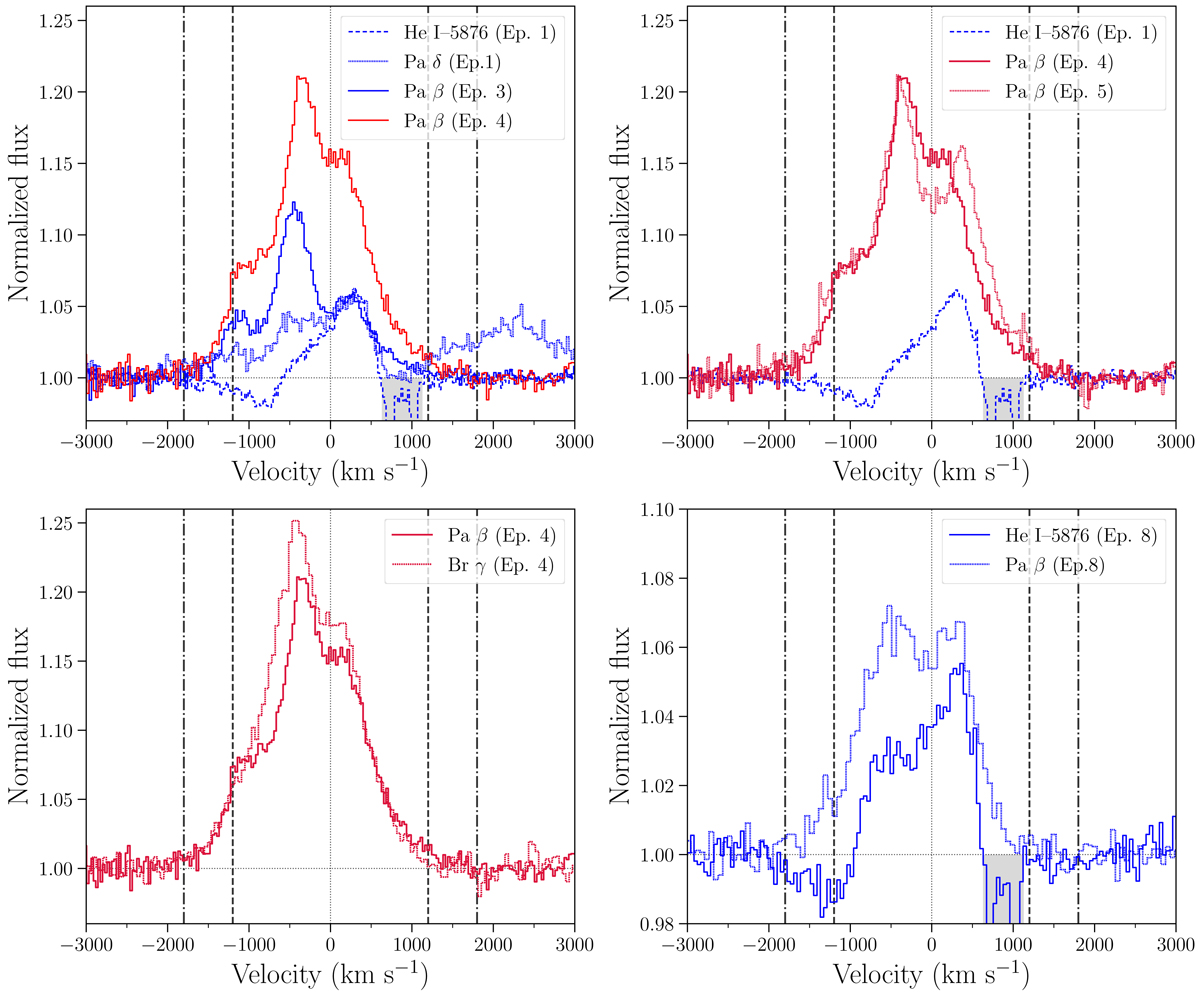
Detailed comparison of some of the emission lines presented in Fig. 2. The characteristic wind velocities (from MD19) are marked as dashed (±1200 km s−1) and dash-dotted (±1800 km s−1) vertical lines. The colour code reflects the different X-ray states as in Fig. 2. The Na interstellar doublet in the red wing of He I–5876 is shaded. Top left panel: Paδ (epoch 1) and Paβ (epochs 3 and 4) during the rising phase of the outburst. Blue-shifted absorption troughs with a blue-edge velocity of ∼1200 km s−1 are visible. These are compared with the He I–5876 P Cyg profile from epoch 1. Top right panel: two soft-state epochs (4 and 5) of Paβ against the He I–5876 P Cyg profile from epoch 1. Bottom left panel: Paβ and Brγ from epoch 4 showing clear differences in the blue part of the line up to ∼200 km s−1. Bottom right panel: He I–5876 (epoch 8) showing a P Cyg profile with a terminal velocity of ∼1800 km s−1. Paβ (also epoch 8) displays a double-peaked profile whose blue wing reaches higher velocities (∼1800 km s−1) than the red wing. The flux scale in this panel is different from that of the previous panels.
Current usage metrics show cumulative count of Article Views (full-text article views including HTML views, PDF and ePub downloads, according to the available data) and Abstracts Views on Vision4Press platform.
Data correspond to usage on the plateform after 2015. The current usage metrics is available 48-96 hours after online publication and is updated daily on week days.
Initial download of the metrics may take a while.