Fig. 2.
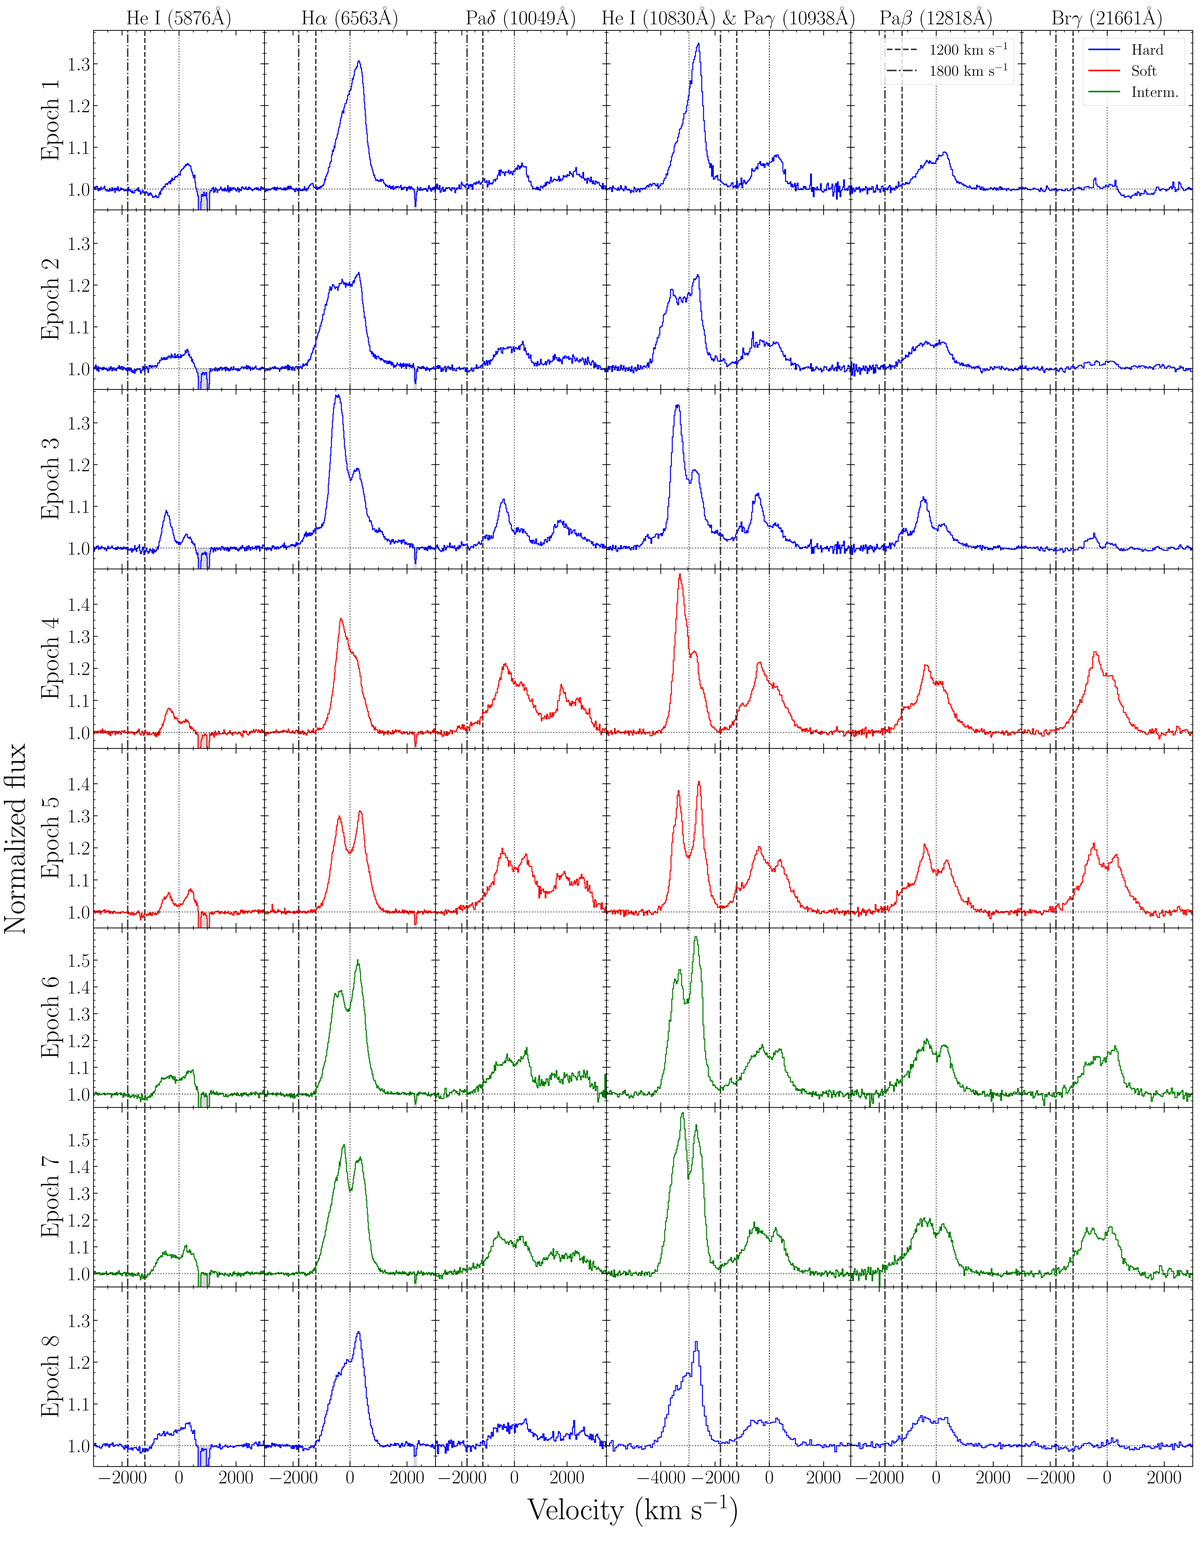
Evolution of the main NIR emission lines across the outburst. The optical transitions Hα and He I–5876 lines are also included for comparison. Every line is plotted normalised in a separate panel, with the exception of He I–10 830 and Paγ, which share axes due to their proximity. He II at 10 124 Å can also be seen in the Paδ panels, especially during the soft-state epochs. The characteristic wind velocities determined in MD19 are plotted as dashed (1200 km s−1) and dash-dotted (1800 km s−1) lines.
Current usage metrics show cumulative count of Article Views (full-text article views including HTML views, PDF and ePub downloads, according to the available data) and Abstracts Views on Vision4Press platform.
Data correspond to usage on the plateform after 2015. The current usage metrics is available 48-96 hours after online publication and is updated daily on week days.
Initial download of the metrics may take a while.