Fig. 6.
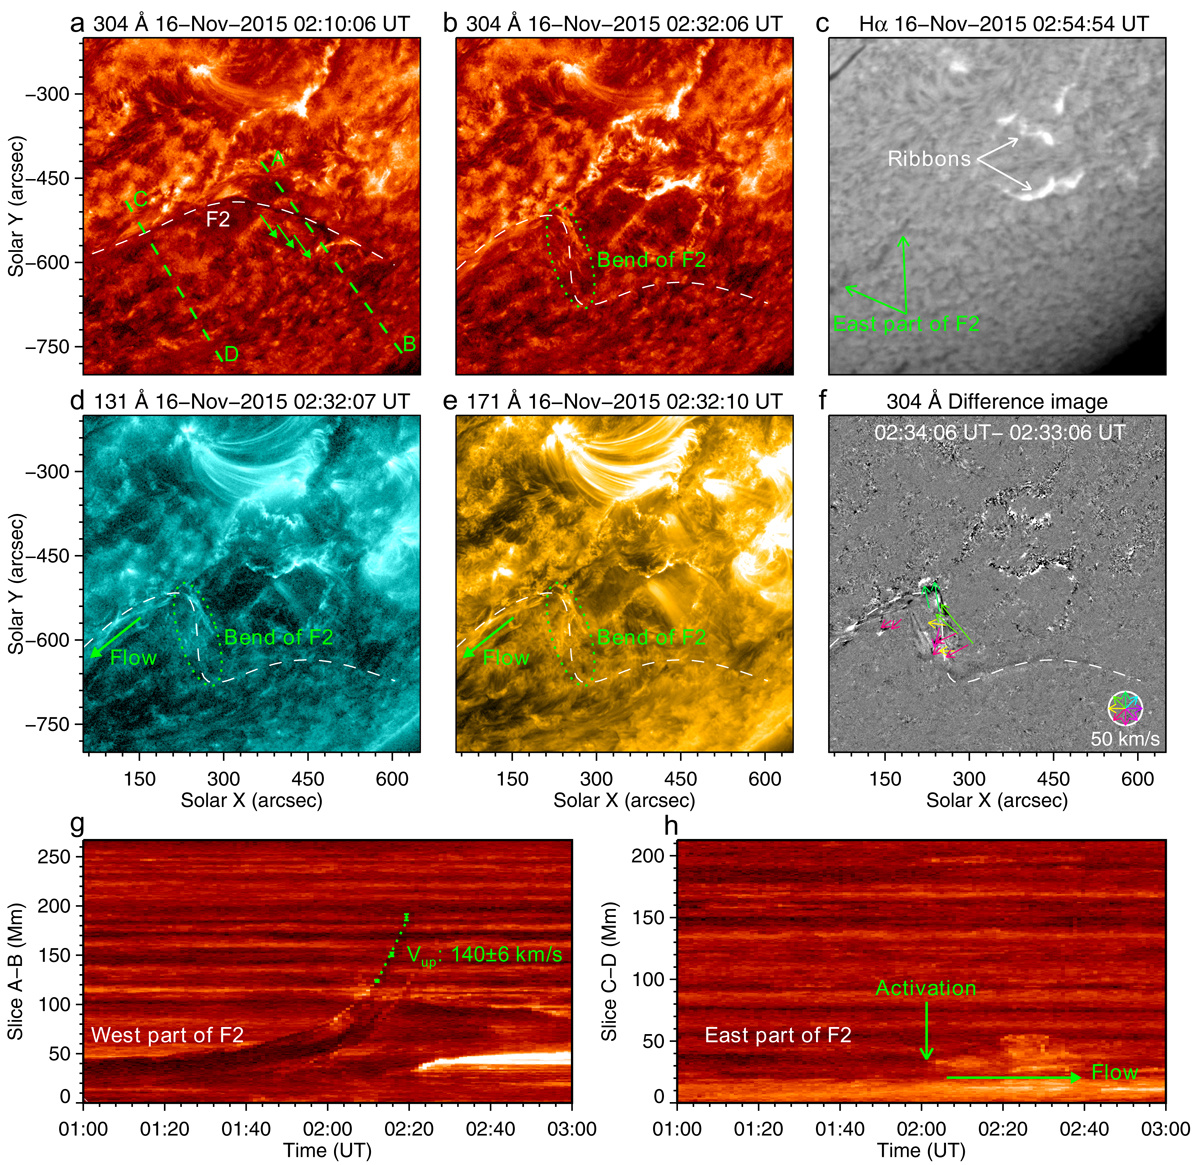
Partial eruption of F2. (a)–(c): 304 Å and Hα images showing partial eruption of F2. Green arrows in (a) denote eruptive direction of the west part of F2. Green ellipse in (b) marks a bending structure in the middle part of F2 during its rapid rising phase. White curves in (a)–(b) delineate the axis of eruptive F2. (d)–(f): 131 Å, 171 Å images, and difference image of 304 Å corresponding to (b). Green arrows in (d) and (e) represent southeastward motion of the activated material of the east part of F2. The colored arrows in (f) represent the horizontal velocity fields of filament material with values larger than 30 km s−1 derived from 304 Å images through LCT method. (g)–(h): Time-distance plots derived from the 304 Å images along lines “A–B” and “C–D” shown in (a). The dotted oblique line in (g) delineates linear fitting of the front of eruptive F2 in its rapid rising phase. An associated animation of 304 Å, 171 Å, and 131 Å images, covering 23:50 UT on November 15 to 03:59 UT on November 16, is available online.
Current usage metrics show cumulative count of Article Views (full-text article views including HTML views, PDF and ePub downloads, according to the available data) and Abstracts Views on Vision4Press platform.
Data correspond to usage on the plateform after 2015. The current usage metrics is available 48-96 hours after online publication and is updated daily on week days.
Initial download of the metrics may take a while.