Fig. 3.
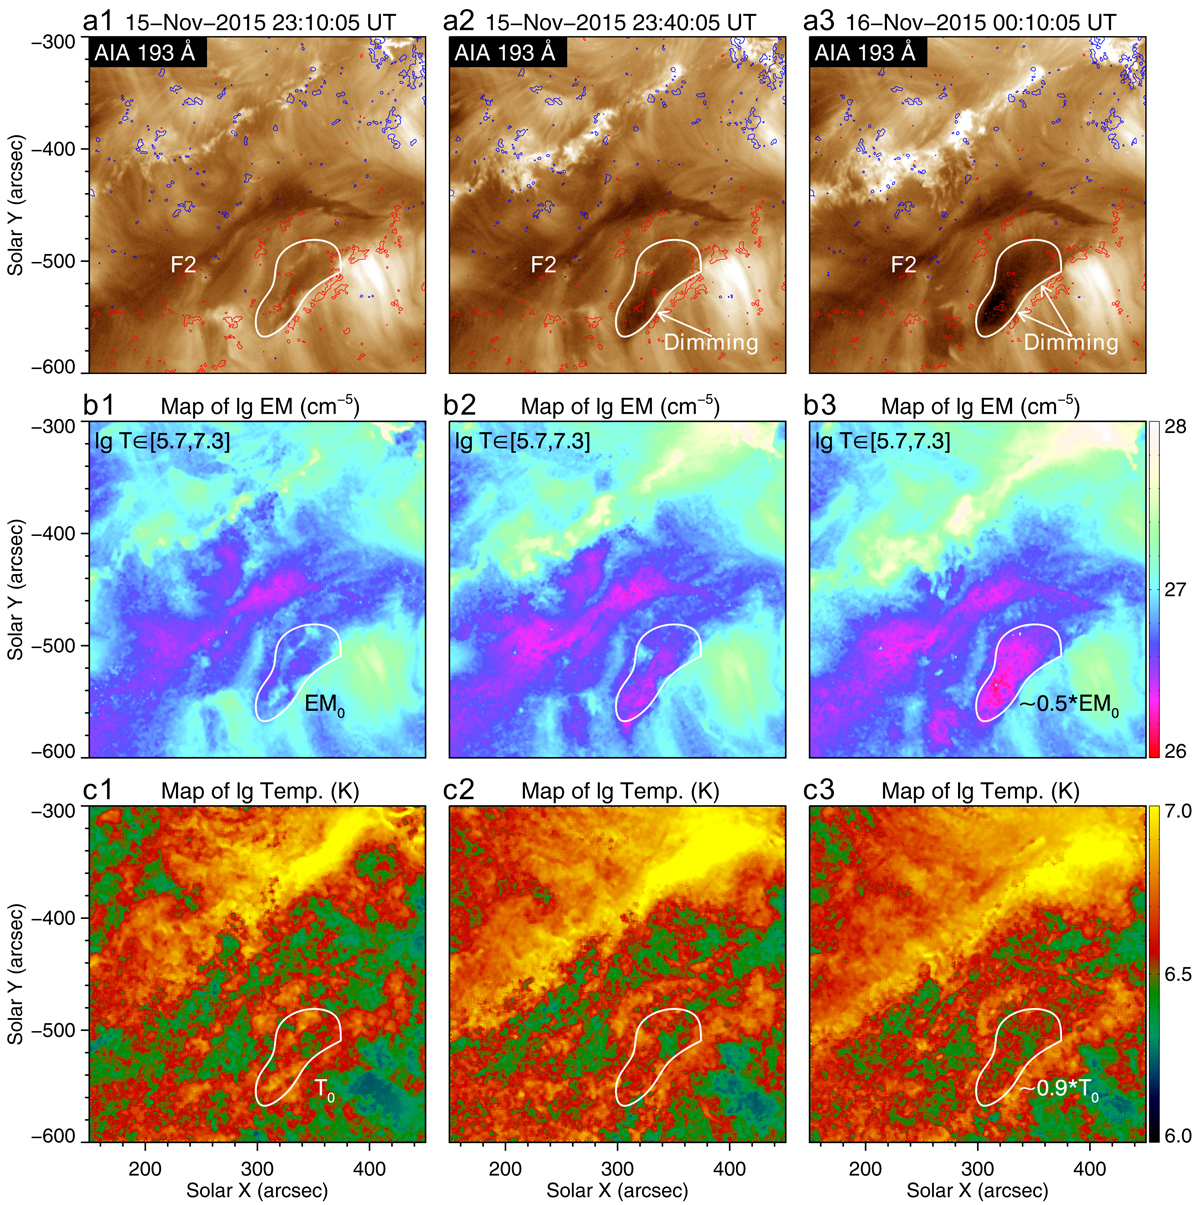
Coronal dimming on the south side of pre-eruption F2. (a1)–(a3): Sequence of AIA 193 Å images showing the appearance of coronal dimming on the south side of F2 before its eruption. The red and blue curves are contours of the HMI LOS magnetograms at ±50 G. The white curves outline the border of the dimming region around 00:10 UT on November 16. (b1)–(c3): Corresponding total EM and DEM-weighted average temperature maps exhibiting the evolution of plasma density and temperature in the dimming region. An associated animation of 193 Å images, covering 23:10 UT on November 15 to 00:10 UT on November 16, is available online.
Current usage metrics show cumulative count of Article Views (full-text article views including HTML views, PDF and ePub downloads, according to the available data) and Abstracts Views on Vision4Press platform.
Data correspond to usage on the plateform after 2015. The current usage metrics is available 48-96 hours after online publication and is updated daily on week days.
Initial download of the metrics may take a while.