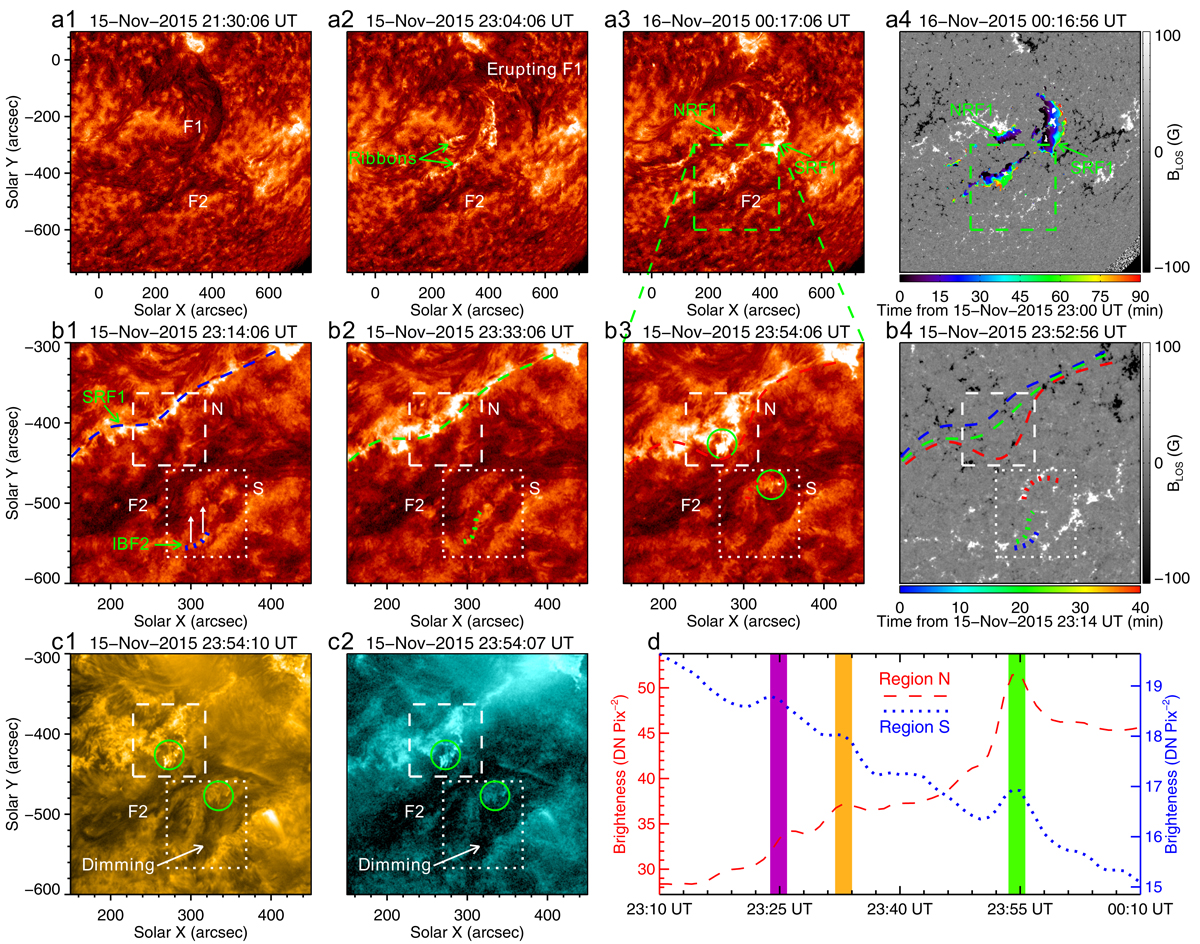
Fig. 2.

Kinematic evolutions of eruptive F1 and the inward-spreading brightening on the south side of pre-eruption F2. (a1)–(a3): Sequence of AIA 304 Å images showing evolutions of F1 and two flare ribbons (NRF1 and SRF1). (a4): HMI LOS magnetogram superimposed with colored regions indicating positions of the evolving flare ribbons detected at different times in the 304 Å channel. (b1)–(b3): Enlarged 304 Å images displaying evolutions of SRF1 (dashed curves) and northward bright ribbon (IRF2) appearing on the south side of F2 (dotted curves). Green circles in (b3) indicate simultaneous brightenings on opposite sides of F2. (b4): Similar to (a4), but for the ribbons approaching F2 from two sides. (c1)–(c2): 171 Å and 131 Å images corresponding to (b3). (d): Variations in mean emission strength of the 304 Å passband within the regions N and S in (b1)–(b3). An associated animation of the 304 Å, 171 Å, and 131 Å images, covering 21:30 UT on November 15 to 00:30 UT on November 16, is available online.
Current usage metrics show cumulative count of Article Views (full-text article views including HTML views, PDF and ePub downloads, according to the available data) and Abstracts Views on Vision4Press platform.
Data correspond to usage on the plateform after 2015. The current usage metrics is available 48-96 hours after online publication and is updated daily on week days.
Initial download of the metrics may take a while.


