Fig. 4.
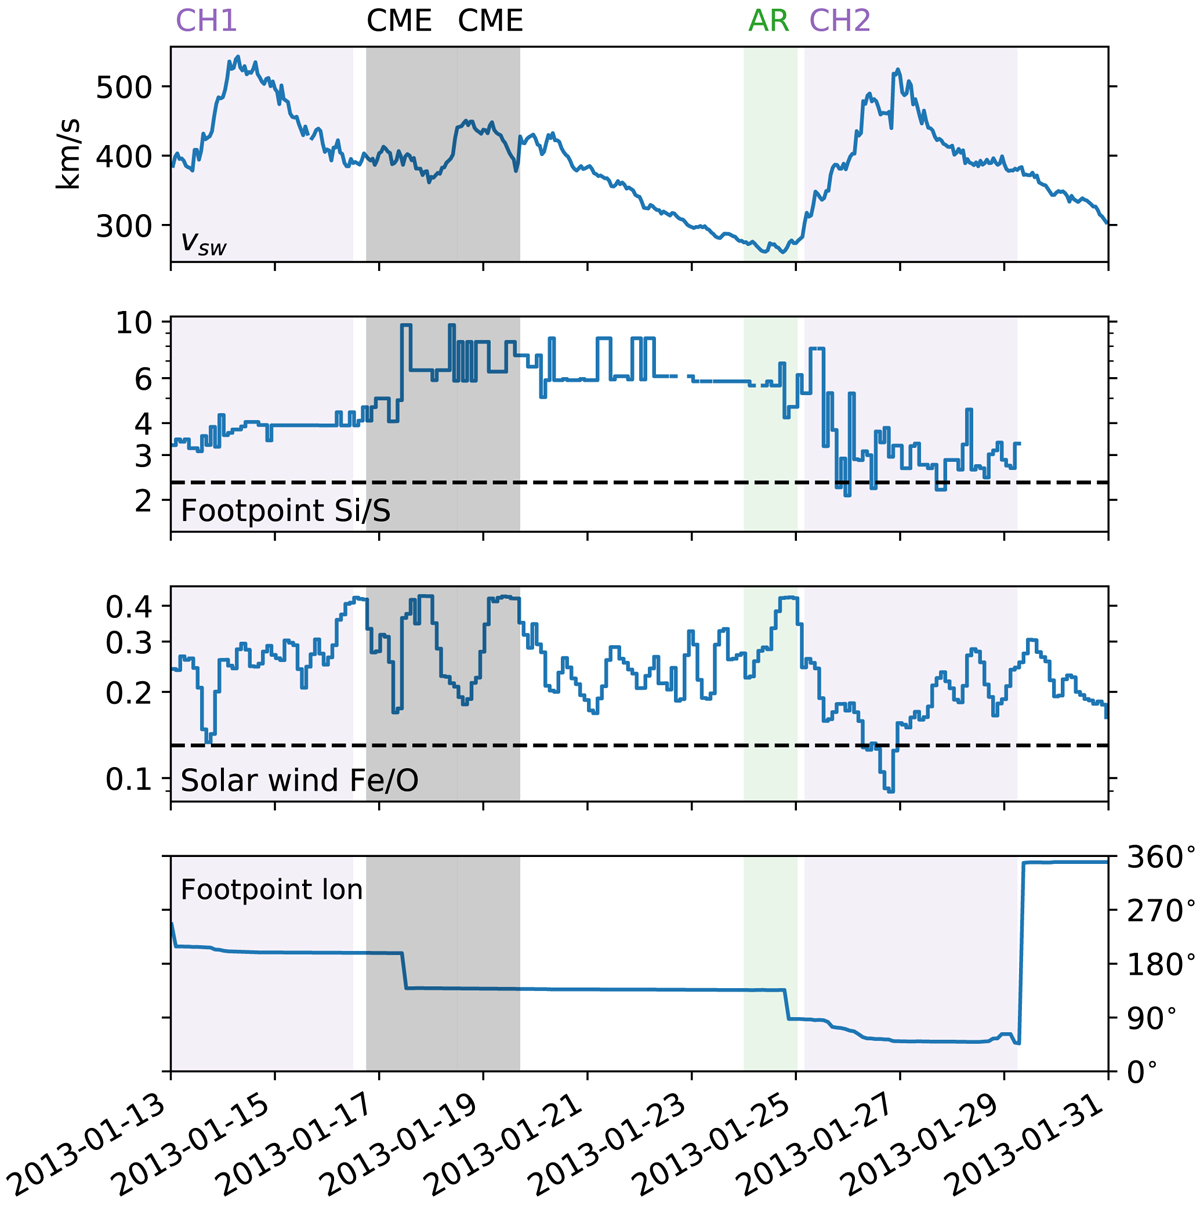
Direct comparison of inferred coronal Silicon to Sulphur coronal abundance (second panel) at the predicted solar wind source regions and solar wind Iron to Oxygen abundance (third panel). Dashed horizontal lines show photospheric abundances taken from Scott et al. (2015a,b). Top panel: in situ measured solar wind speed for context, and the bottom panel shows the predicted footpoint Carrington longitude.
Current usage metrics show cumulative count of Article Views (full-text article views including HTML views, PDF and ePub downloads, according to the available data) and Abstracts Views on Vision4Press platform.
Data correspond to usage on the plateform after 2015. The current usage metrics is available 48-96 hours after online publication and is updated daily on week days.
Initial download of the metrics may take a while.