Fig. 3.
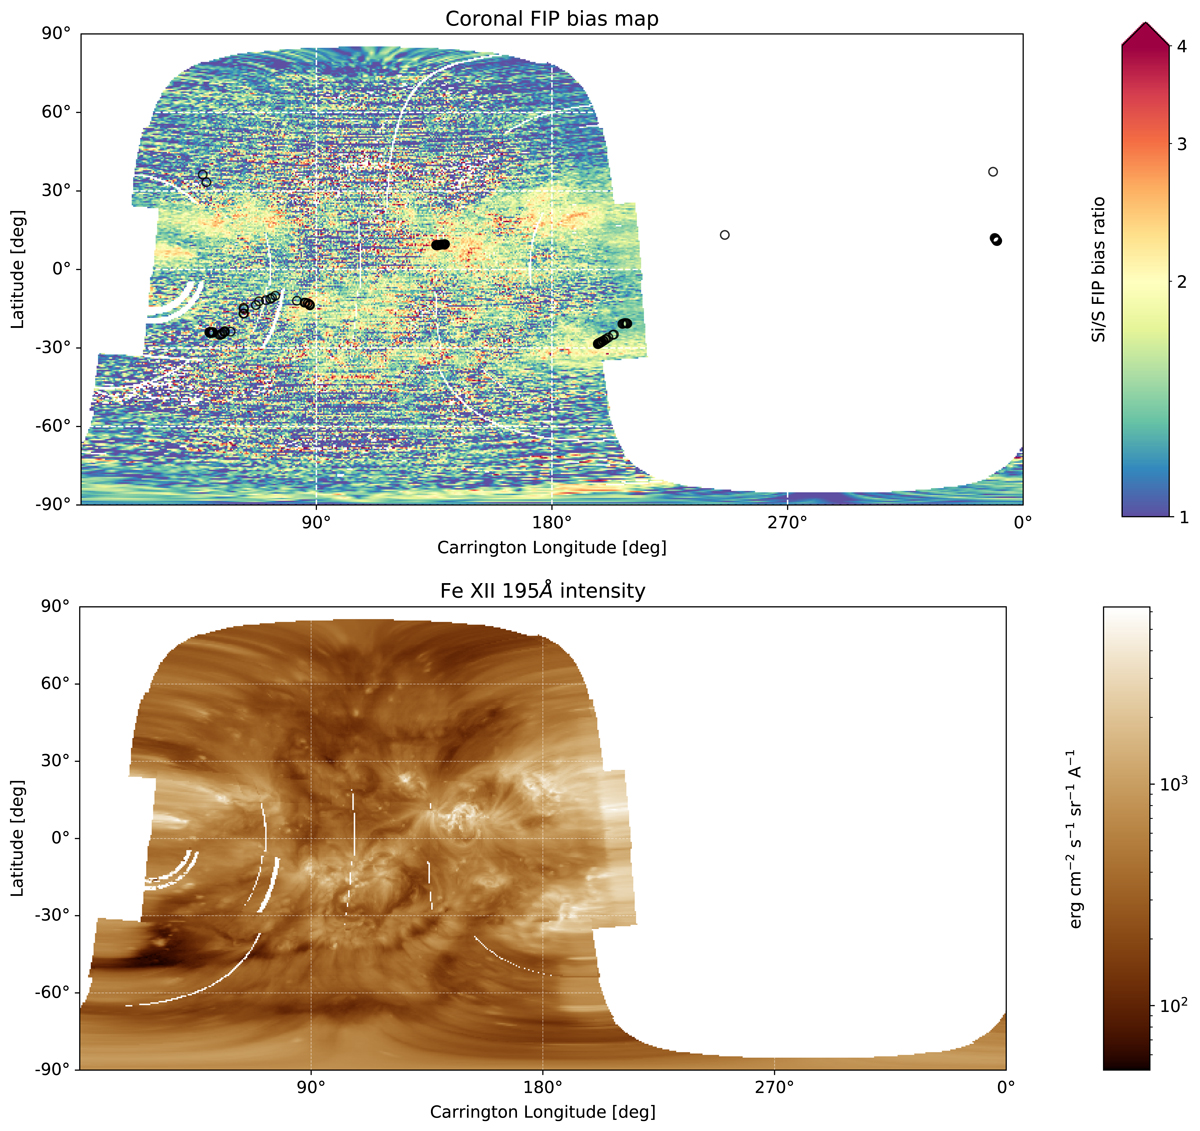
Synoptic maps showing FIP bias and EUV emission. Top panel: map of the Si/S First Ionisation Potential (FIP) bias ratio, with predicted ACE solar wind source regions overlain with black circles. Bottom panel: total intensity in the FE XII 195.120 Å line, which lies close to the AIA 193 Å passband shown in Fig. 1. The brighter areas of EUV emission, corresponding to active regions, can be seen to exhibit larger FIP biases.
Current usage metrics show cumulative count of Article Views (full-text article views including HTML views, PDF and ePub downloads, according to the available data) and Abstracts Views on Vision4Press platform.
Data correspond to usage on the plateform after 2015. The current usage metrics is available 48-96 hours after online publication and is updated daily on week days.
Initial download of the metrics may take a while.