Fig. 1.
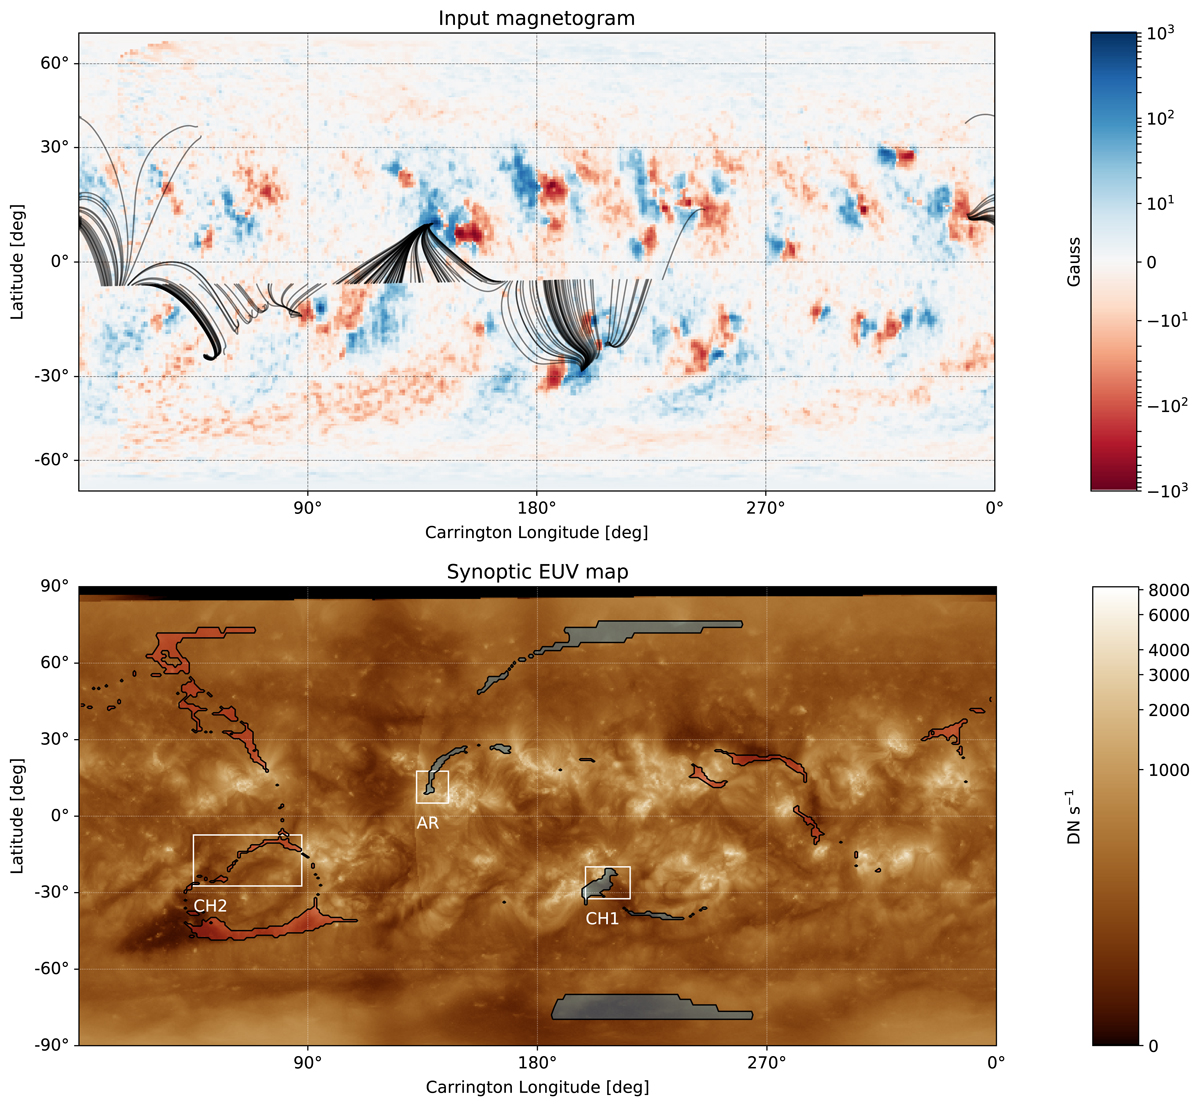
Overview of magnetic field mapping. Top panel: GONG radial field magnetogram used as input to PFSS modelling. Black lines show magnetic field lines traced through the PFSS solution from the source surface to the solar surface. Bottom panel: synoptic AIA 195 Å EUV map, with overplotted contours showing the open field regions of the PFSS model. The white and associated labels identify the three solar wind source regions discussed in the text.
Current usage metrics show cumulative count of Article Views (full-text article views including HTML views, PDF and ePub downloads, according to the available data) and Abstracts Views on Vision4Press platform.
Data correspond to usage on the plateform after 2015. The current usage metrics is available 48-96 hours after online publication and is updated daily on week days.
Initial download of the metrics may take a while.