Free Access
Fig. B.3.
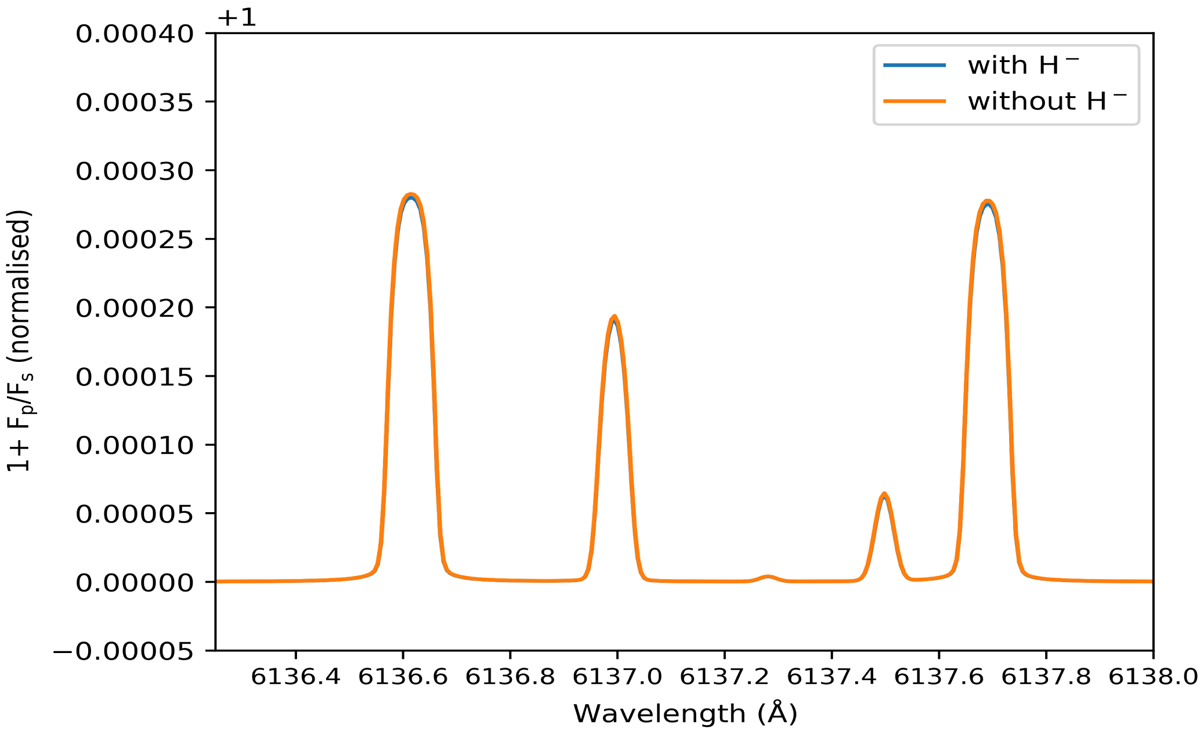
Comparison between the normalised model spectra with and without the H− continuum opacity. The spectra were calculated using the same parameters as in Fig. B.2. The line depths between the two models are almost the same, indicating that the H− contribution can be neglected in our analysis.
Current usage metrics show cumulative count of Article Views (full-text article views including HTML views, PDF and ePub downloads, according to the available data) and Abstracts Views on Vision4Press platform.
Data correspond to usage on the plateform after 2015. The current usage metrics is available 48-96 hours after online publication and is updated daily on week days.
Initial download of the metrics may take a while.