Fig. B.2.
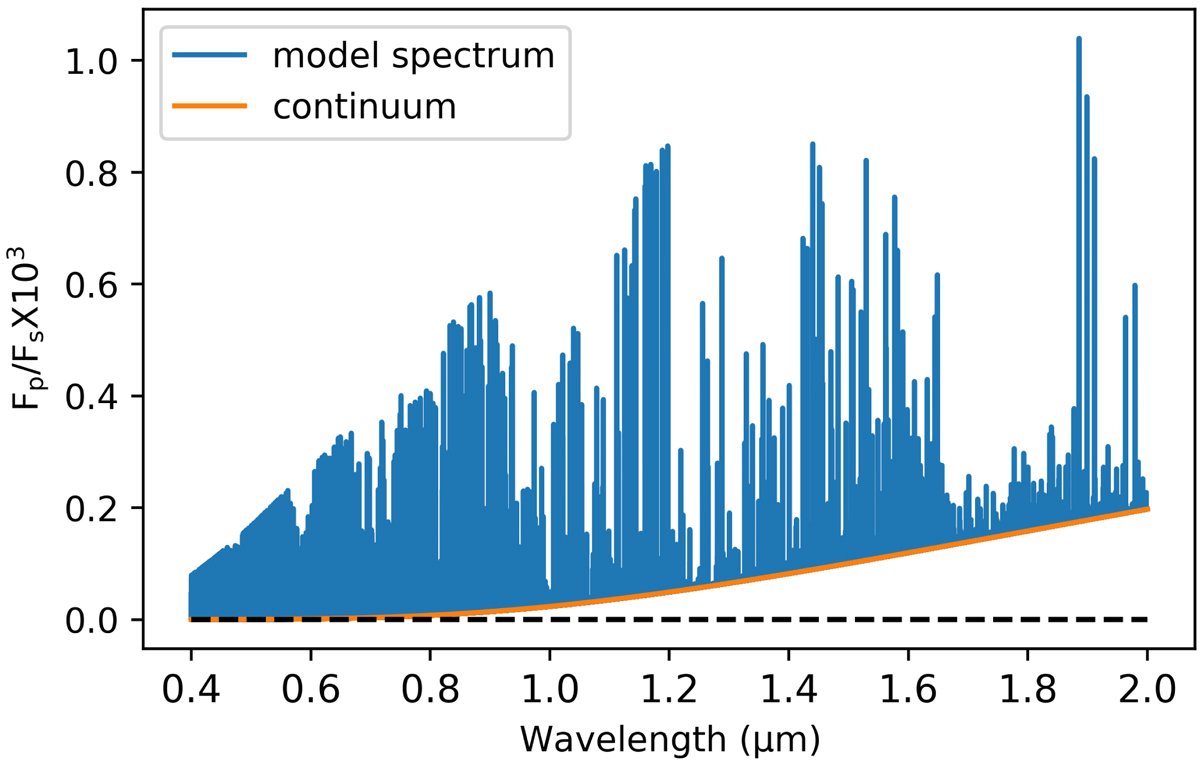
Example of the modelled spectrum (the blue line) and the corresponding continuum (the orange line). The dashed black line shows the zero flux level. The spectra were calculated using the best-fit T–P profile in Fig. 5. The continuum corresponds to the blackbody spectrum at the temperature of T2. In the HARPS-N wavelength range (i.e. below 0.69 μm), the flux at the Fe I line core is much larger than the continuum flux.
Current usage metrics show cumulative count of Article Views (full-text article views including HTML views, PDF and ePub downloads, according to the available data) and Abstracts Views on Vision4Press platform.
Data correspond to usage on the plateform after 2015. The current usage metrics is available 48-96 hours after online publication and is updated daily on week days.
Initial download of the metrics may take a while.