Free Access
Fig. 4.
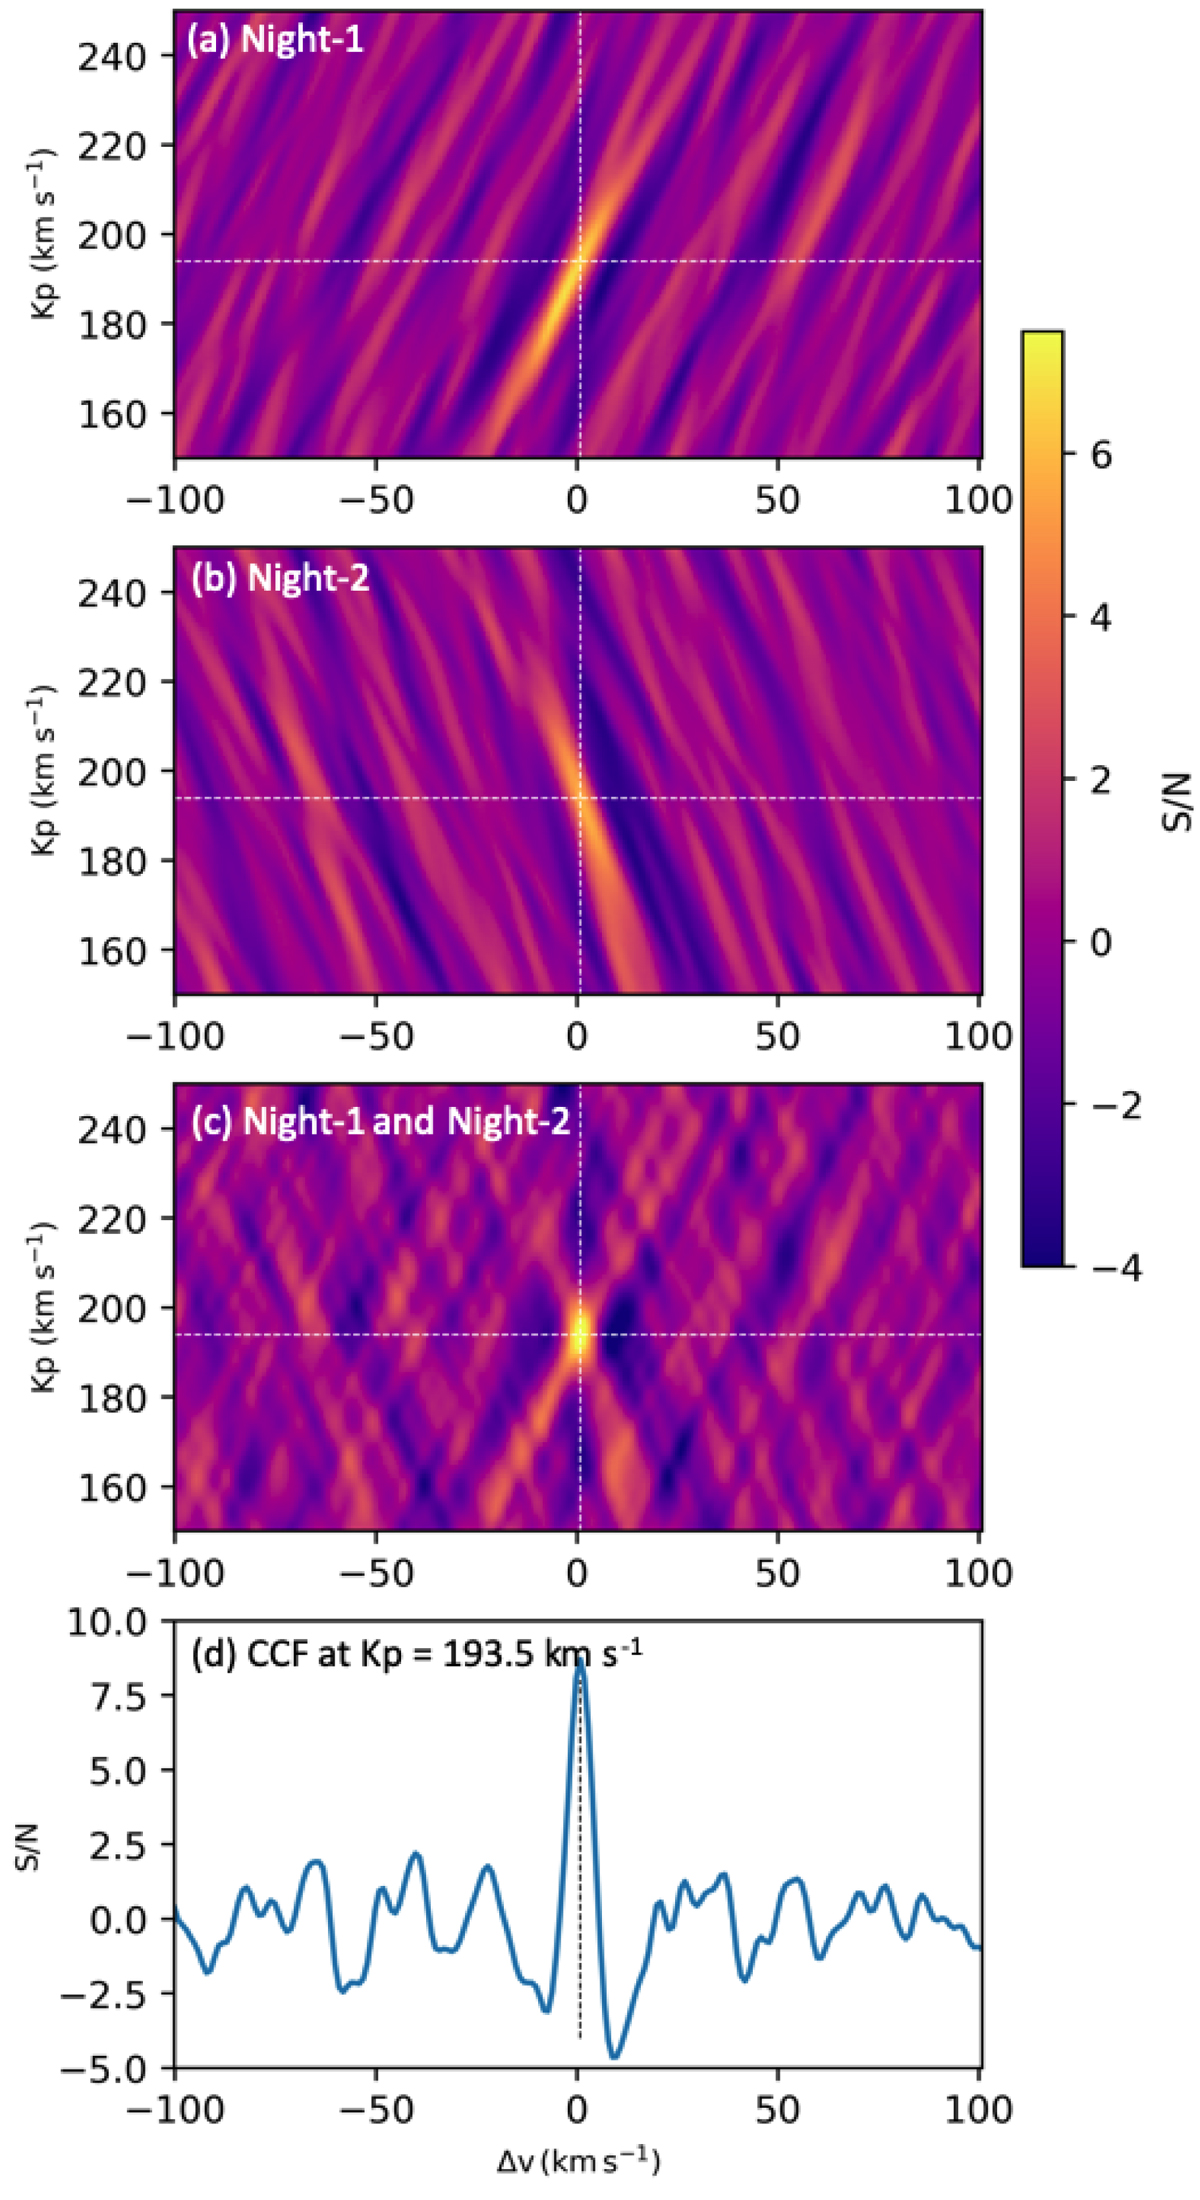
The Kp–Δv maps. Panels a and b: maps for the Night-1 and Night-2 data, respectively. Panel c: map for the data from both nights combined. Bottom panel: CCF at the best-fit Kp. The dashed lines indicate the best-fit Kp and Δv values.
Current usage metrics show cumulative count of Article Views (full-text article views including HTML views, PDF and ePub downloads, according to the available data) and Abstracts Views on Vision4Press platform.
Data correspond to usage on the plateform after 2015. The current usage metrics is available 48-96 hours after online publication and is updated daily on week days.
Initial download of the metrics may take a while.