Fig. 3.
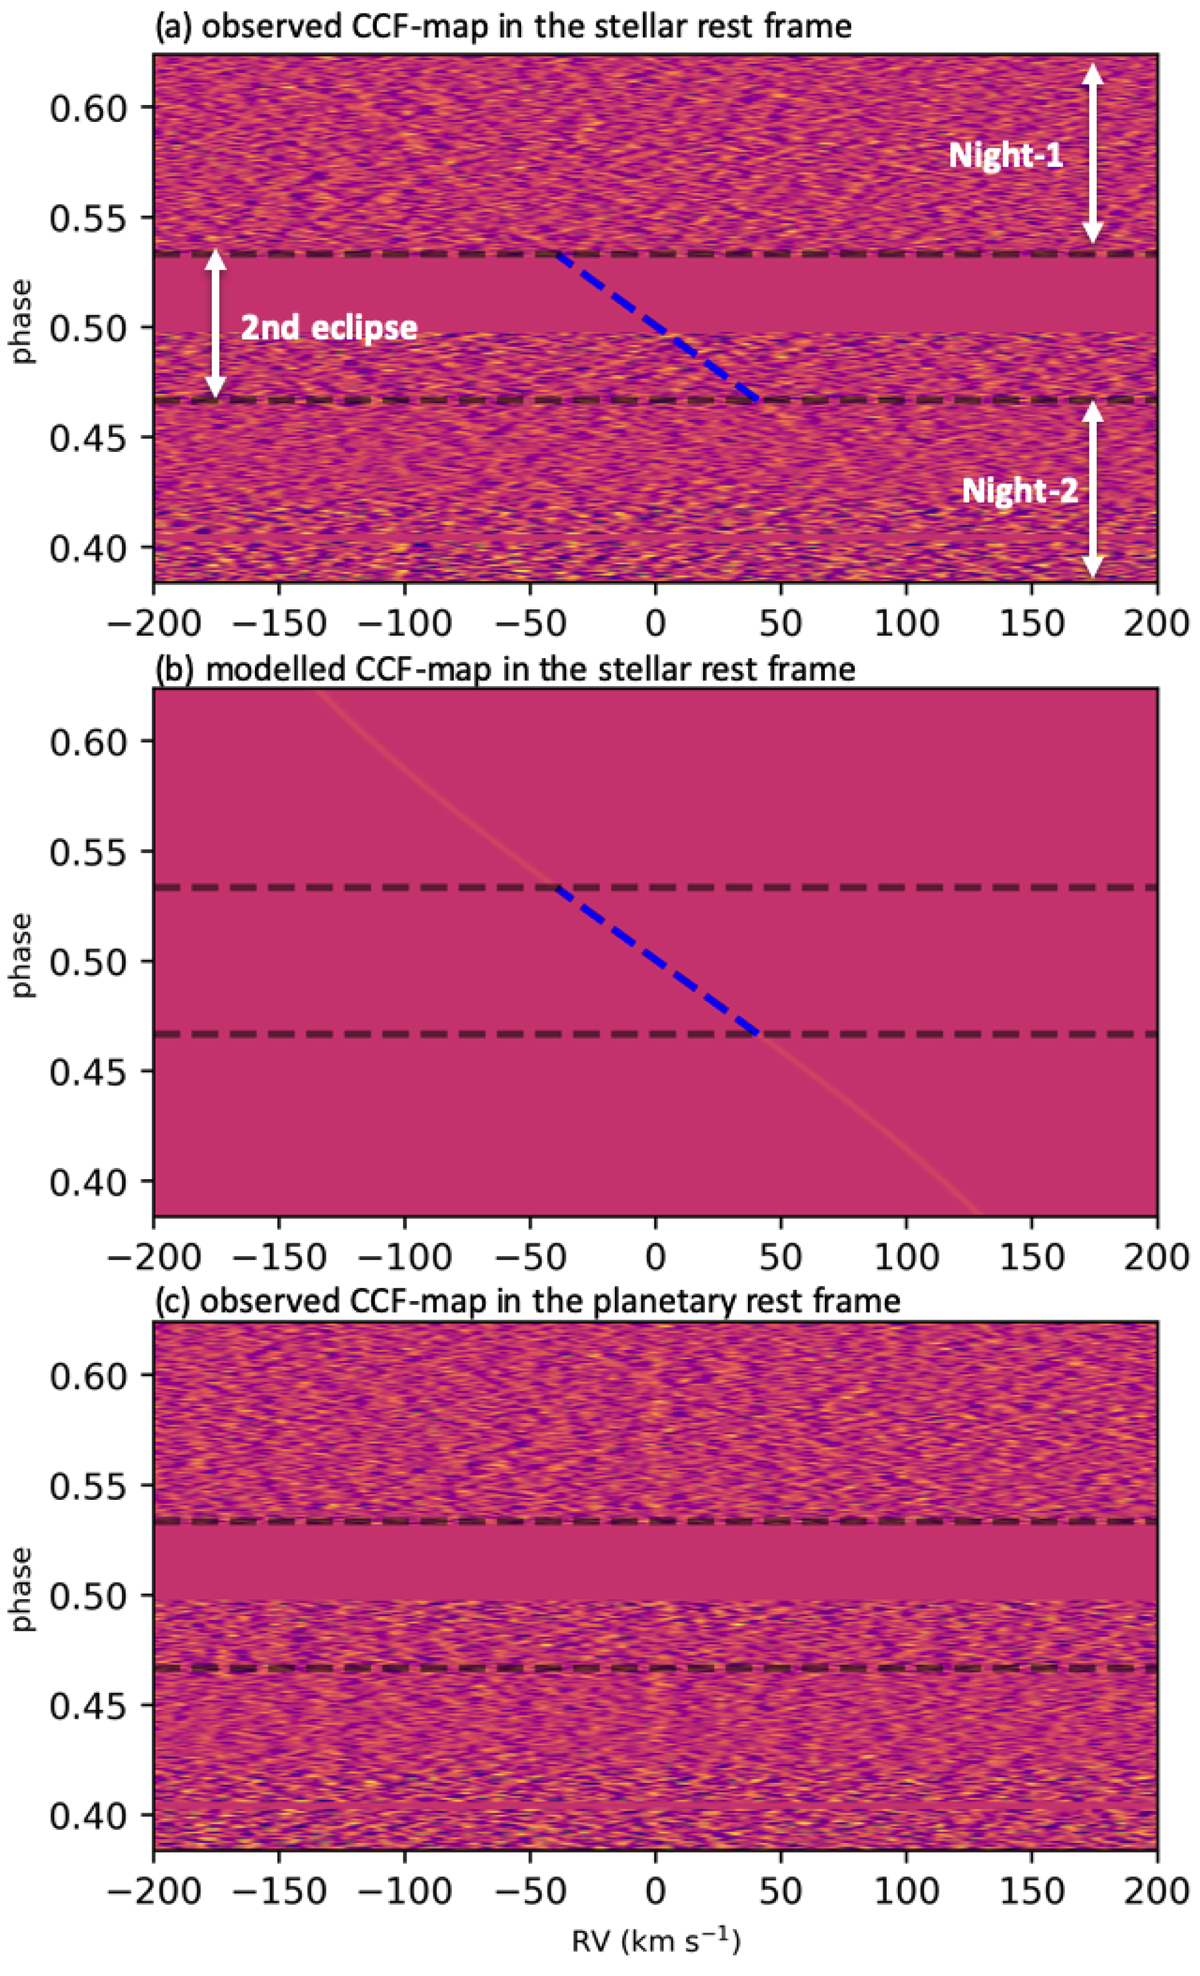
Cross-correlation functions of the observations from the two nights. Upper and middle panels: observed and modelled CCF map in the stellar rest frame, respectively. The atmospheric Fe I signal is the bright stripe that appears during out-of-eclipse. The blue dashed lines indicate the expected planetary RV during eclipse. Bottom panel: CCF map with the planetary velocity (vp) corrected using the best-fit Kp and Δv values, and the atmospheric signal is the vertical stripe located around zero RV.
Current usage metrics show cumulative count of Article Views (full-text article views including HTML views, PDF and ePub downloads, according to the available data) and Abstracts Views on Vision4Press platform.
Data correspond to usage on the plateform after 2015. The current usage metrics is available 48-96 hours after online publication and is updated daily on week days.
Initial download of the metrics may take a while.