Fig. B.4.
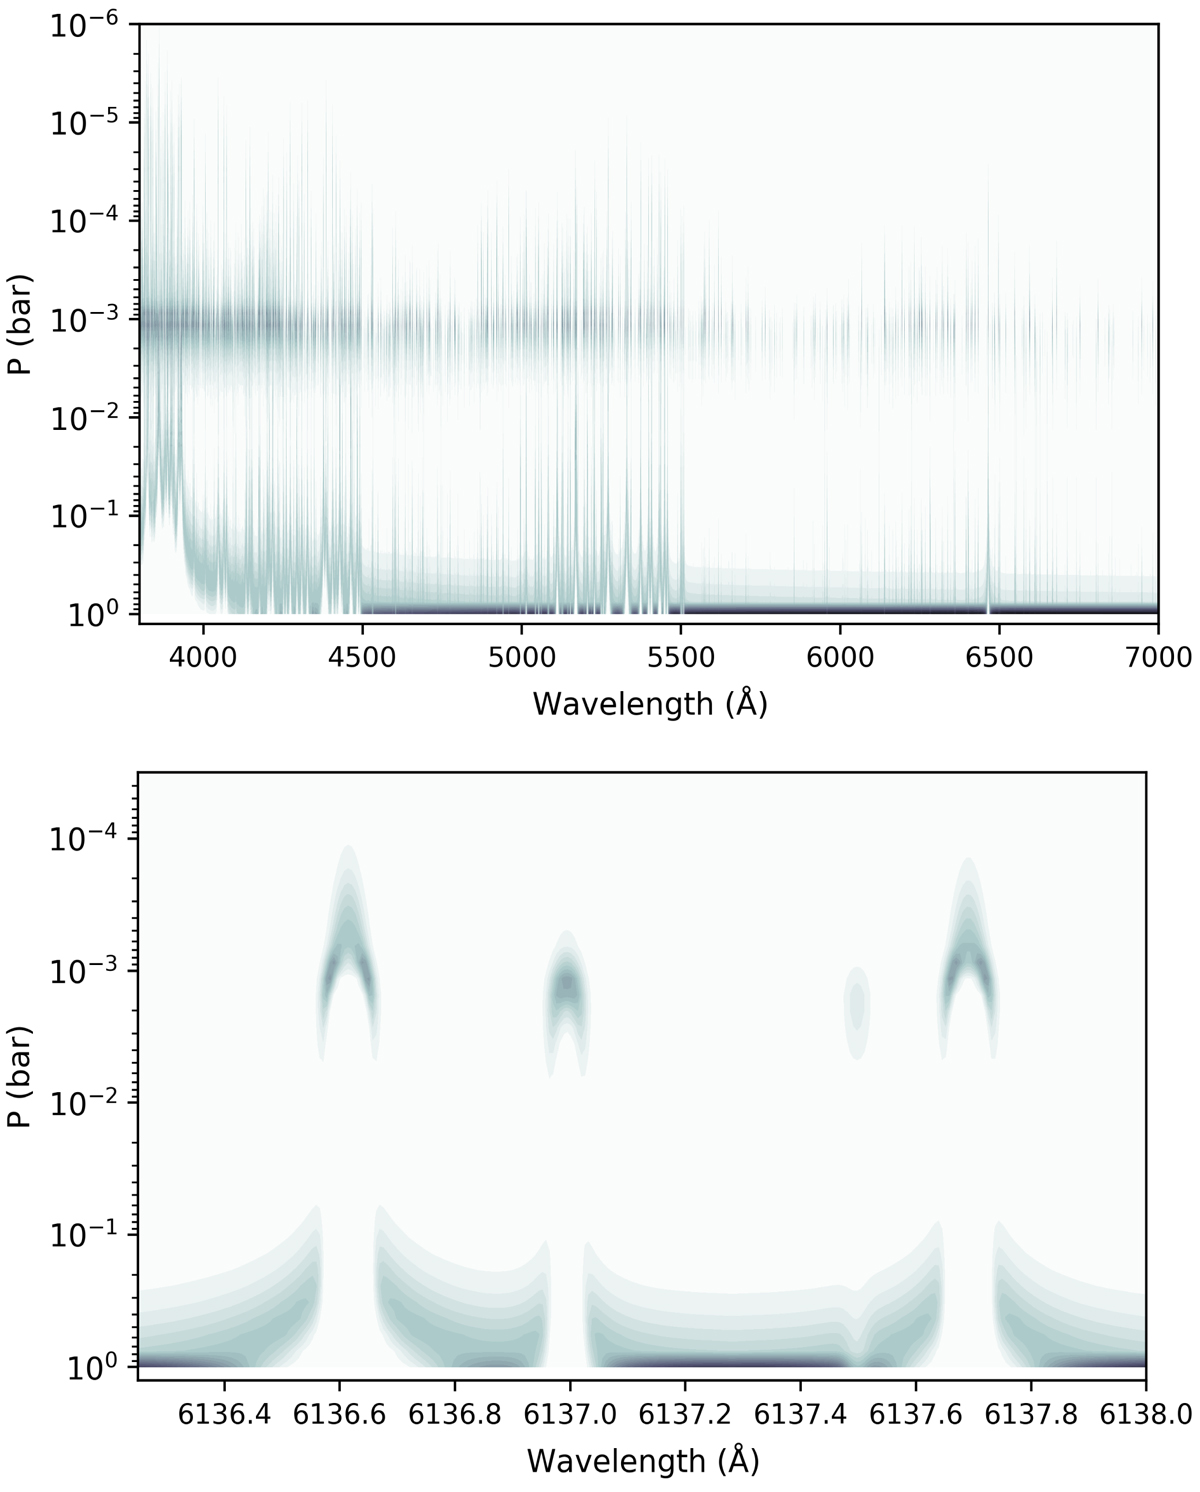
Contribution functions of the thermal emission spectrum calculated using the same parameters as in Fig. B.2. Upper panel: presents the contribution functions over the entire HARPS-N wavelength range and Bottom panel: detailed view in a narrow wavelength range. The contribution functions indicate that the fluxes of the Fe lines are from the upper layer of the temperature inversion, while the continuum flux is from the low altitudes. It appears that we are probing the continuum at the bottom of the atmosphere (which is set as 1 bar), but this result is due to the model setup (i.e. isothermal for pressures larger than P2). The continuum spectrum is the same if we set the atmospheric lower boundary at P2 instead of 1 bar.
Current usage metrics show cumulative count of Article Views (full-text article views including HTML views, PDF and ePub downloads, according to the available data) and Abstracts Views on Vision4Press platform.
Data correspond to usage on the plateform after 2015. The current usage metrics is available 48-96 hours after online publication and is updated daily on week days.
Initial download of the metrics may take a while.