Free Access
Fig. A.2.
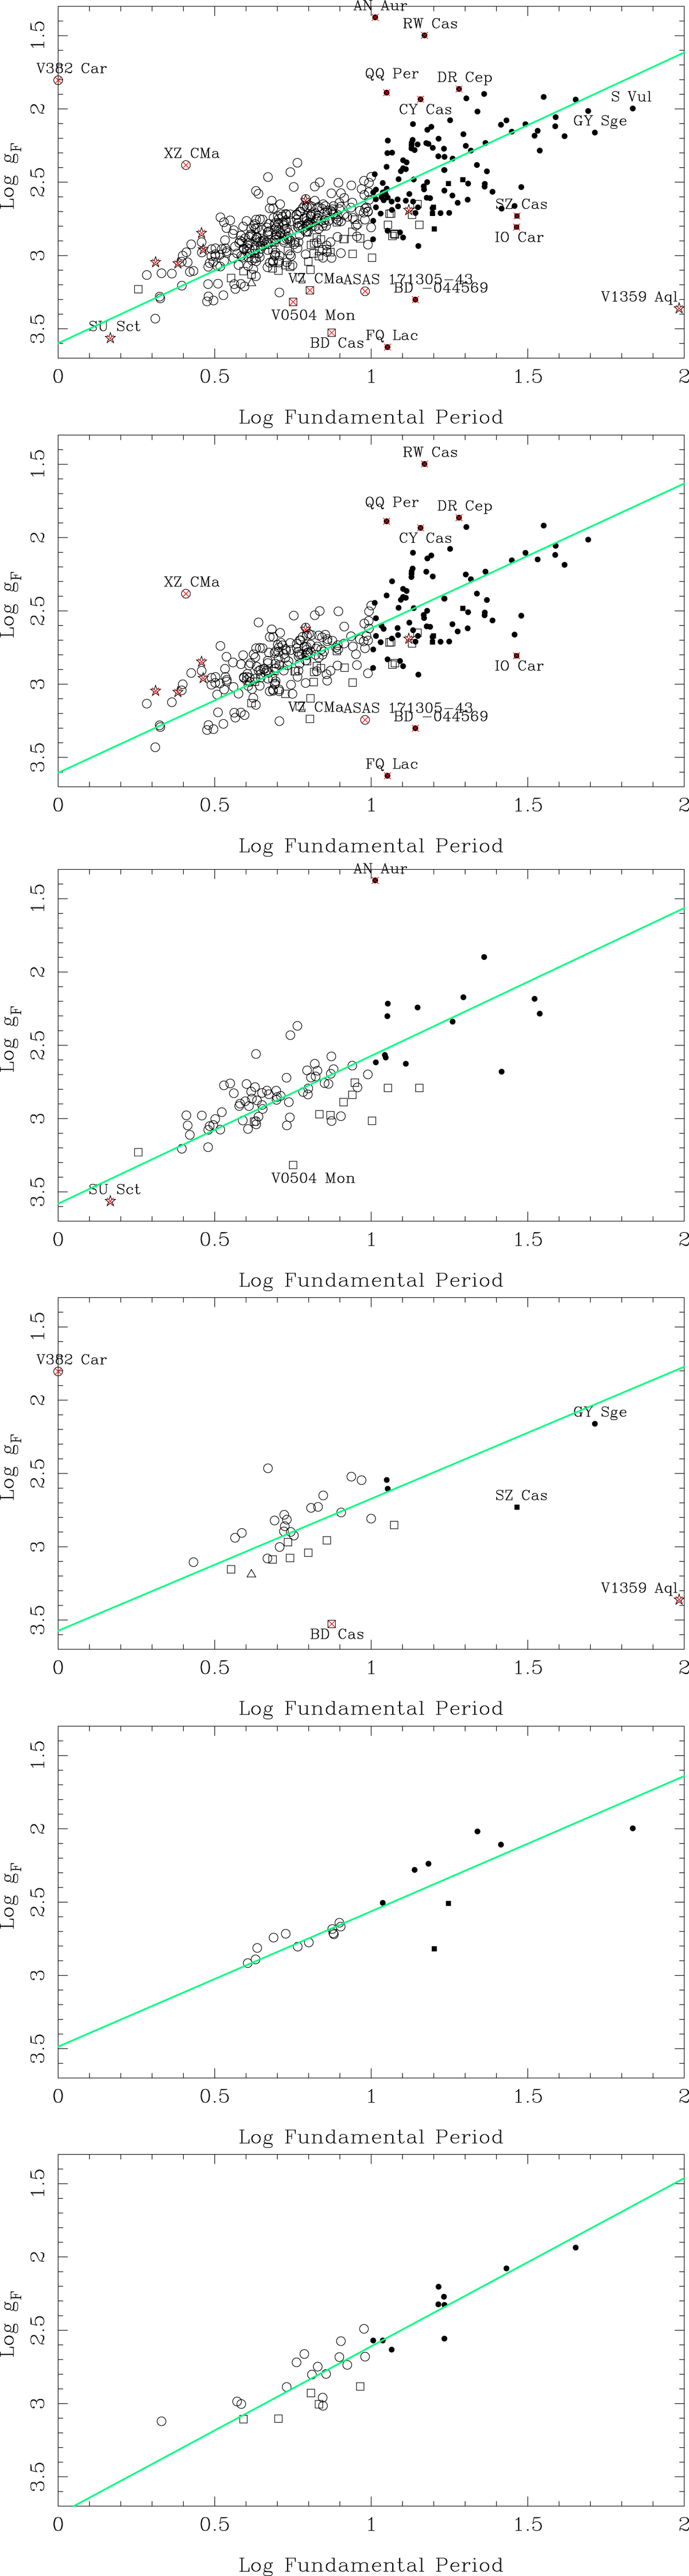
FWG vs period. The data from Genovali et al. (2014) is excluded in all plots. Different panels show different selections on the number of available gF values. From top to bottom: all, Nsp = 1, Nsp = 2, Nsp = 3−5, Nsp = 6−10, Nsp ≥ 11. The green lines refer to the best fits (see Table A.2).
Current usage metrics show cumulative count of Article Views (full-text article views including HTML views, PDF and ePub downloads, according to the available data) and Abstracts Views on Vision4Press platform.
Data correspond to usage on the plateform after 2015. The current usage metrics is available 48-96 hours after online publication and is updated daily on week days.
Initial download of the metrics may take a while.