Fig. 5.
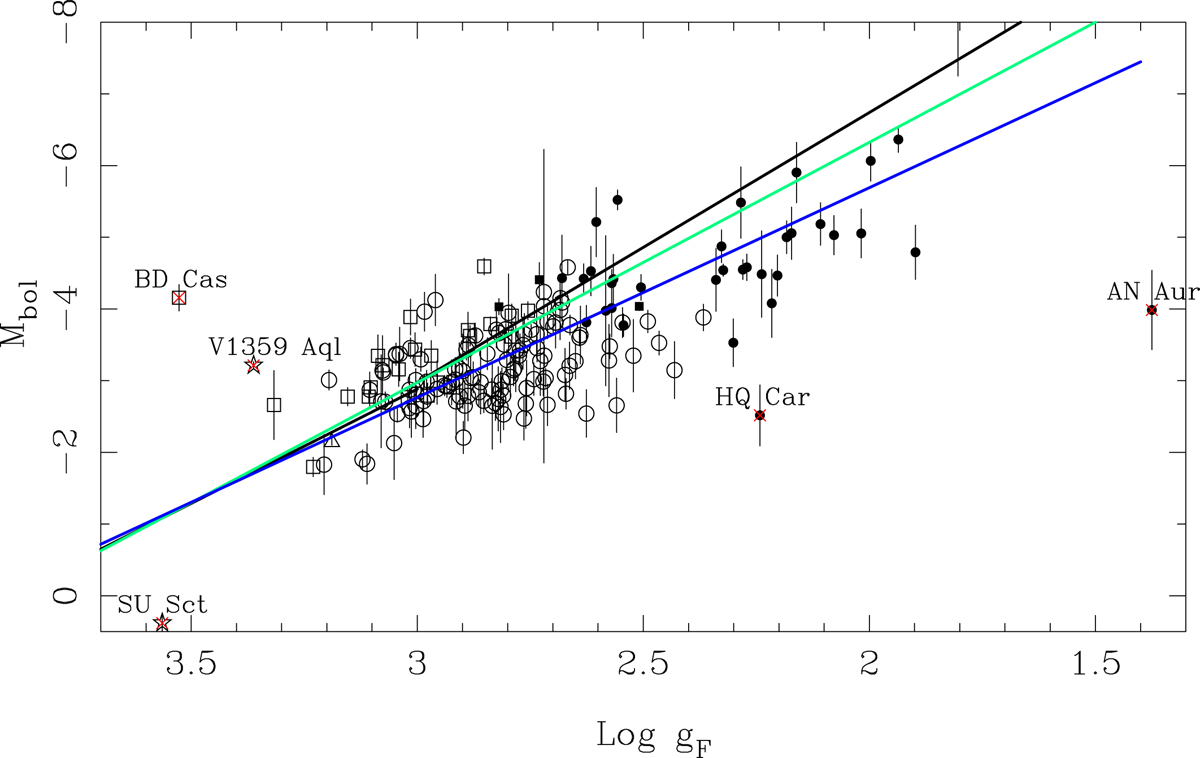
FWGLR, with some outliers named. The black lines refer to Eqs. (1) and (2), the green line to Eq. (3). The blue line refers to the best fit, Eq. (7), which excludes the outliers and non-CCs indicated by a red cross. Outliers located outside the plot window are SU Cru (log gF = 0.19, Mbol = −3.7), SY Nor (log gF = 2.4, Mbol = +3.3), and V382 Car (log gF = 1.8, Mbol = −8.6).
Current usage metrics show cumulative count of Article Views (full-text article views including HTML views, PDF and ePub downloads, according to the available data) and Abstracts Views on Vision4Press platform.
Data correspond to usage on the plateform after 2015. The current usage metrics is available 48-96 hours after online publication and is updated daily on week days.
Initial download of the metrics may take a while.