Free Access
Fig. 2.
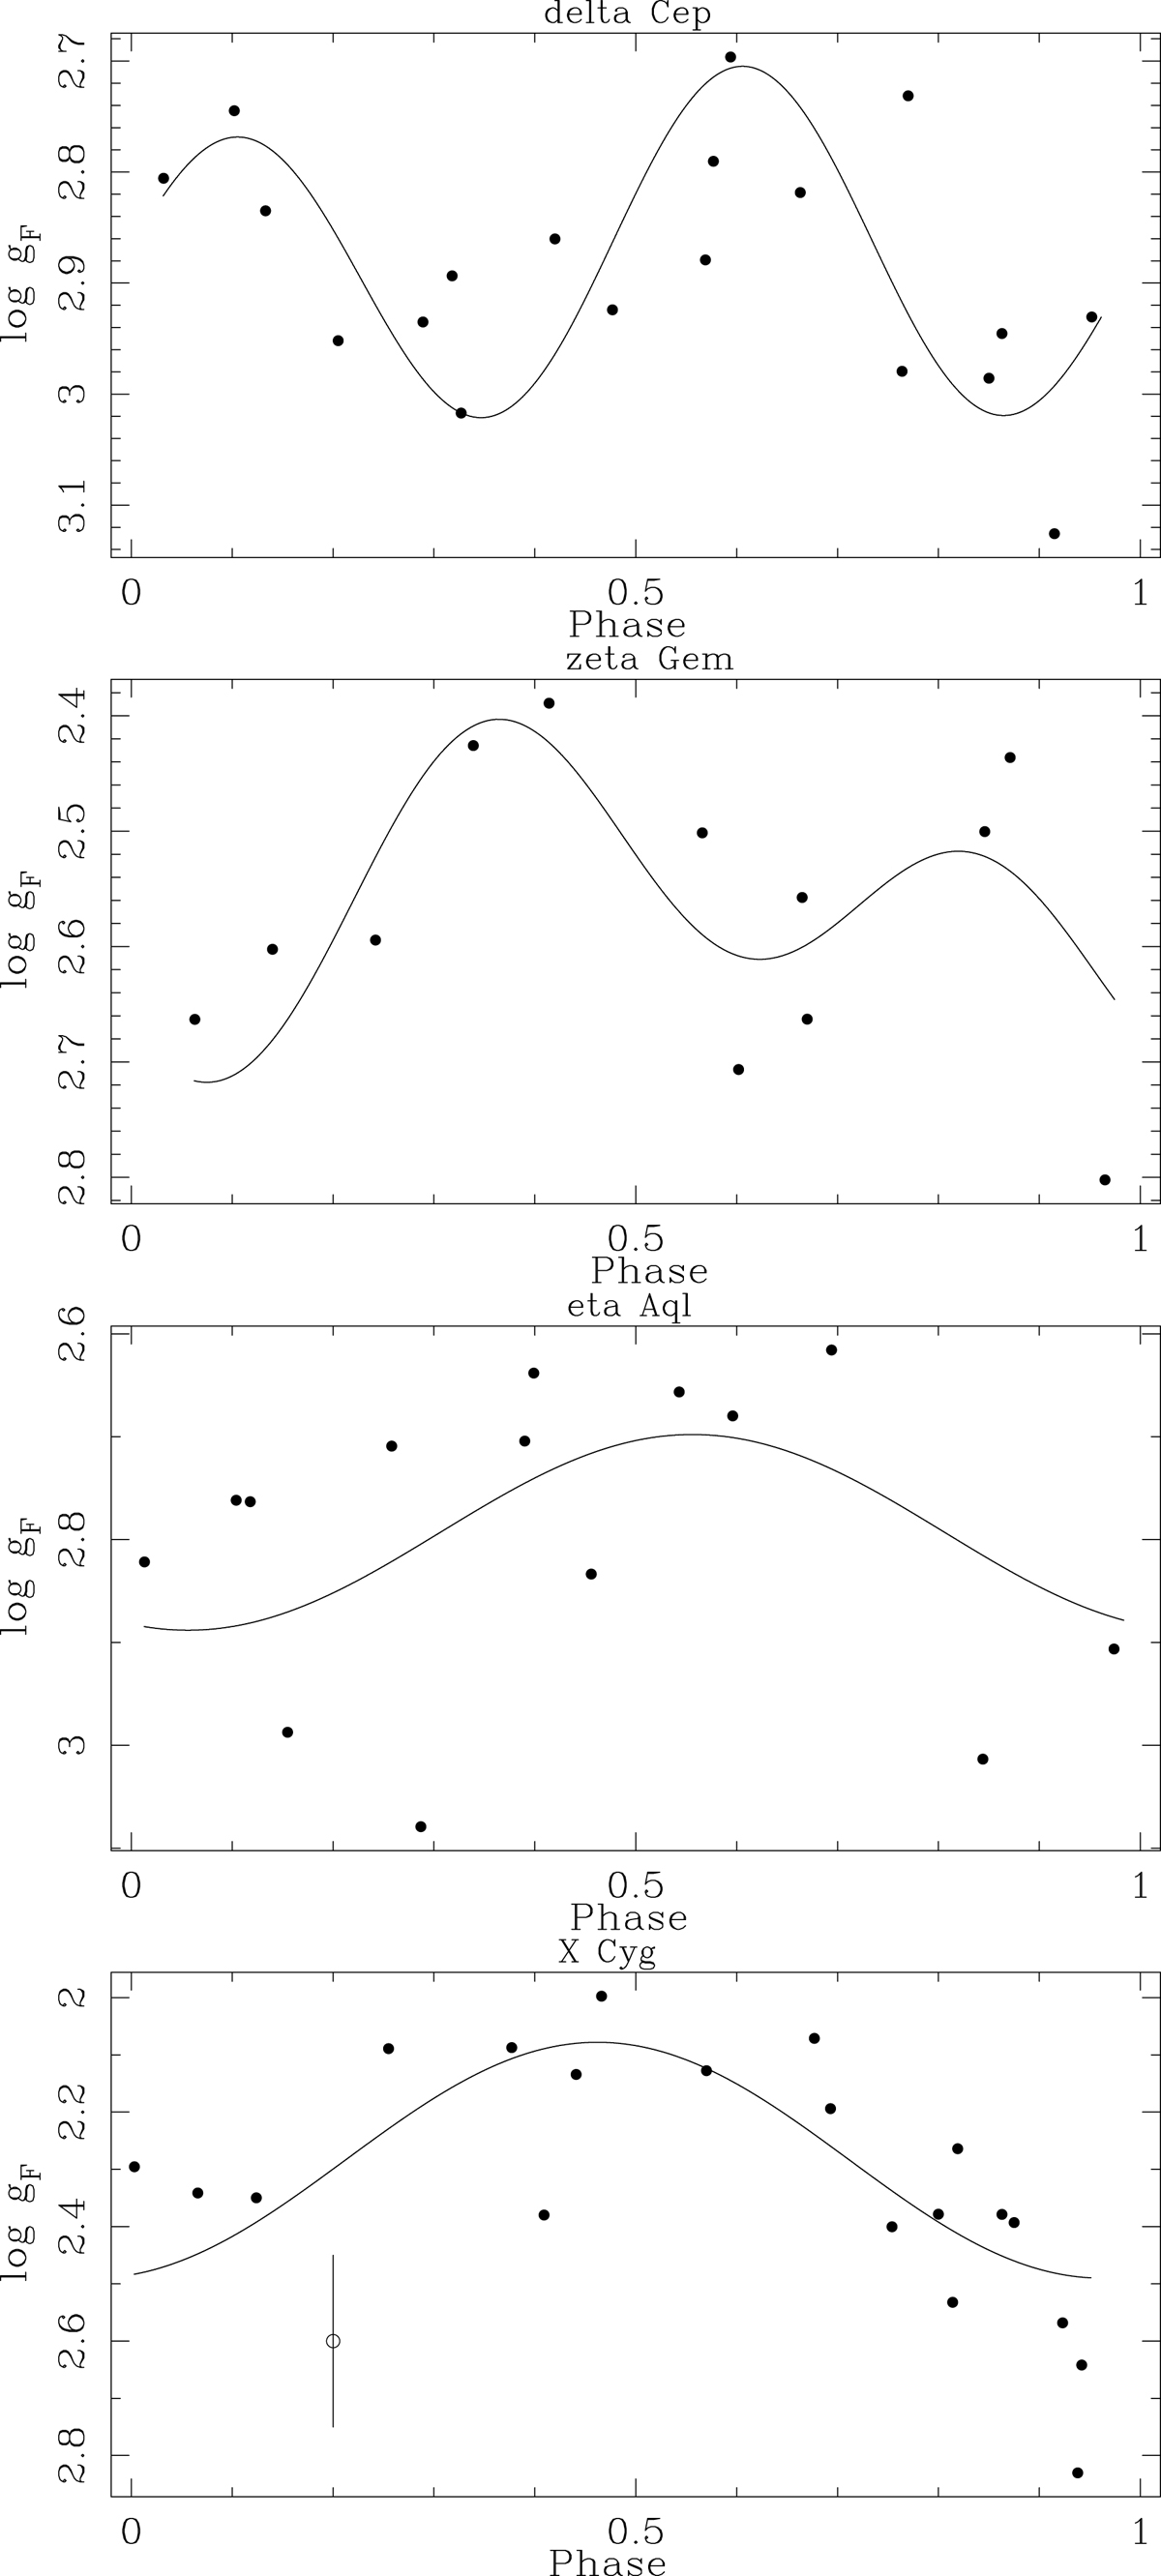
FWG vs pulsation phase for four CCs. The typical error bar in each point is 0.15 dex in FWG, as indicated in the bottom plot. The lines are low-order harmonic fits to the data (see Col. 7 in Table 1).
Current usage metrics show cumulative count of Article Views (full-text article views including HTML views, PDF and ePub downloads, according to the available data) and Abstracts Views on Vision4Press platform.
Data correspond to usage on the plateform after 2015. The current usage metrics is available 48-96 hours after online publication and is updated daily on week days.
Initial download of the metrics may take a while.