Fig. 1.
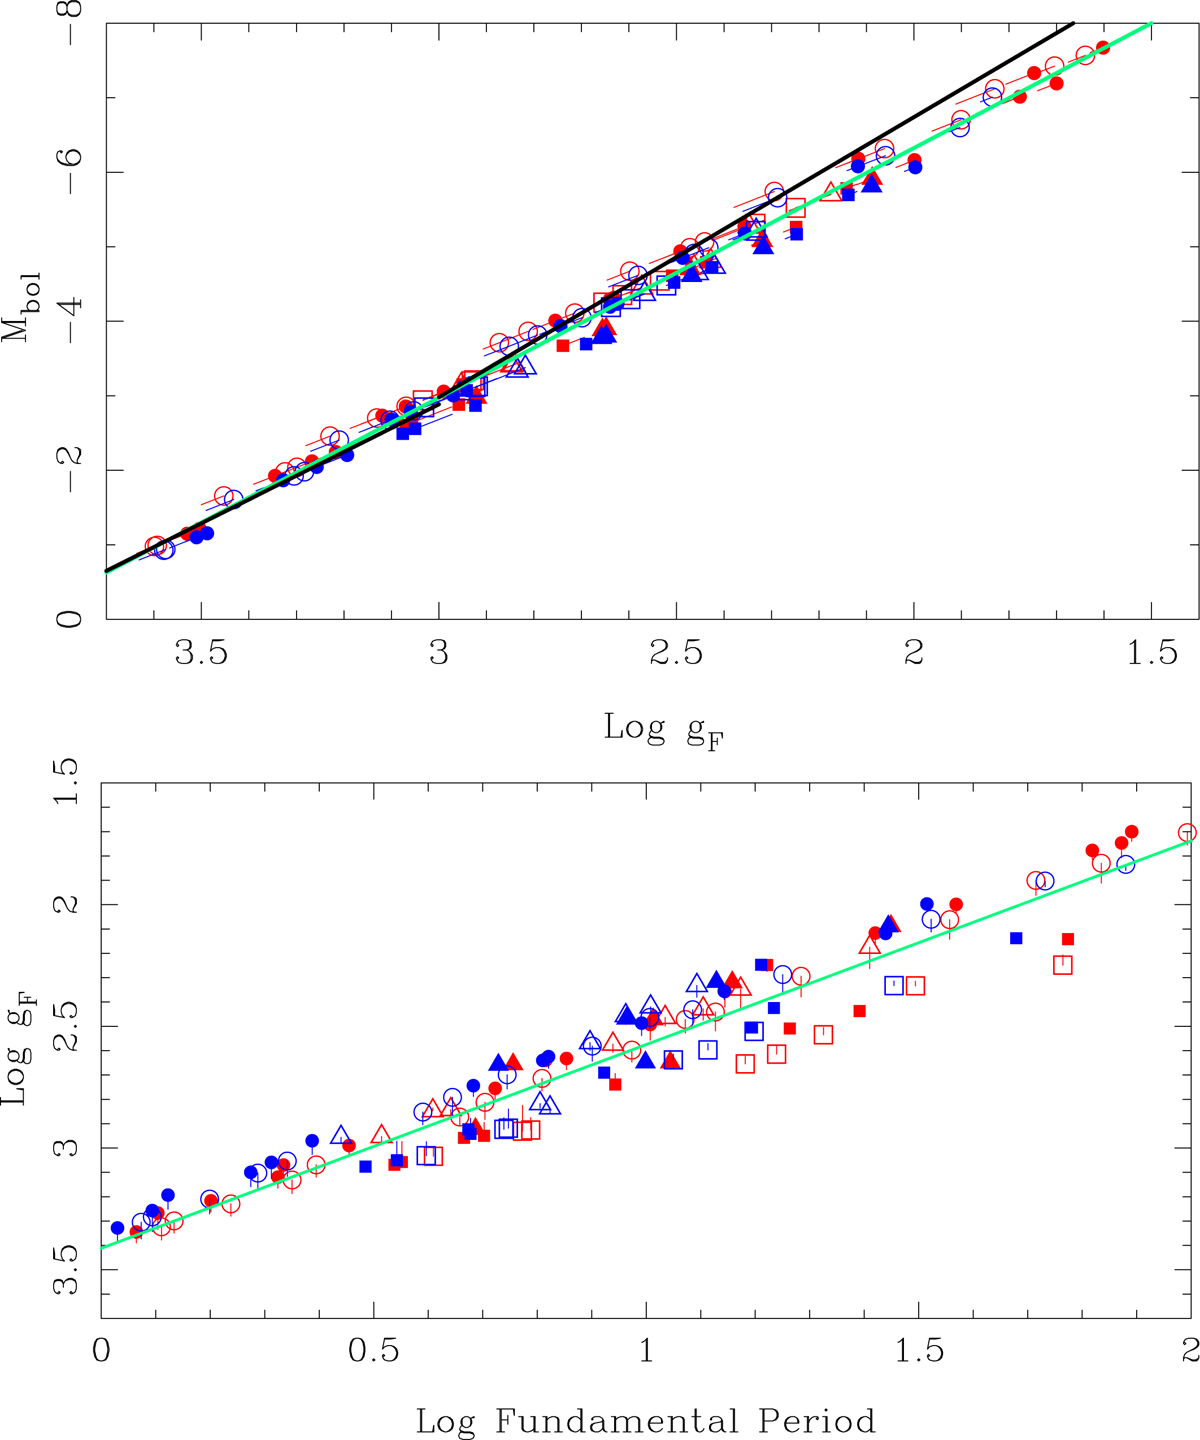
Top panel: FWGLR based on the pulsation models in Anderson et al. (2016). FU models are shown in red, FO models are shown in blue. For clarity FU (FO) models are plotted with an offset of +0.05 (−0.05) dex in Mbol. Symbols indicate the entry point of the IS, the lines connect it to the exit point of the IS. The first, second, and third crossing models are plotted as circles, squares, and triangles, respectively. Solar metallicity models are plotted with open symbols, models with Z = 0.006 with filled symbols. The black lines refer to Eqs. (1) and (2), the green line to the best fit (Eq. (3)). Bottom panel: relation between FWG and period for the same models. The period of the FO models was fundamentalised. The green line refers to the best fit, Eq. (4).
Current usage metrics show cumulative count of Article Views (full-text article views including HTML views, PDF and ePub downloads, according to the available data) and Abstracts Views on Vision4Press platform.
Data correspond to usage on the plateform after 2015. The current usage metrics is available 48-96 hours after online publication and is updated daily on week days.
Initial download of the metrics may take a while.