Fig. 8.
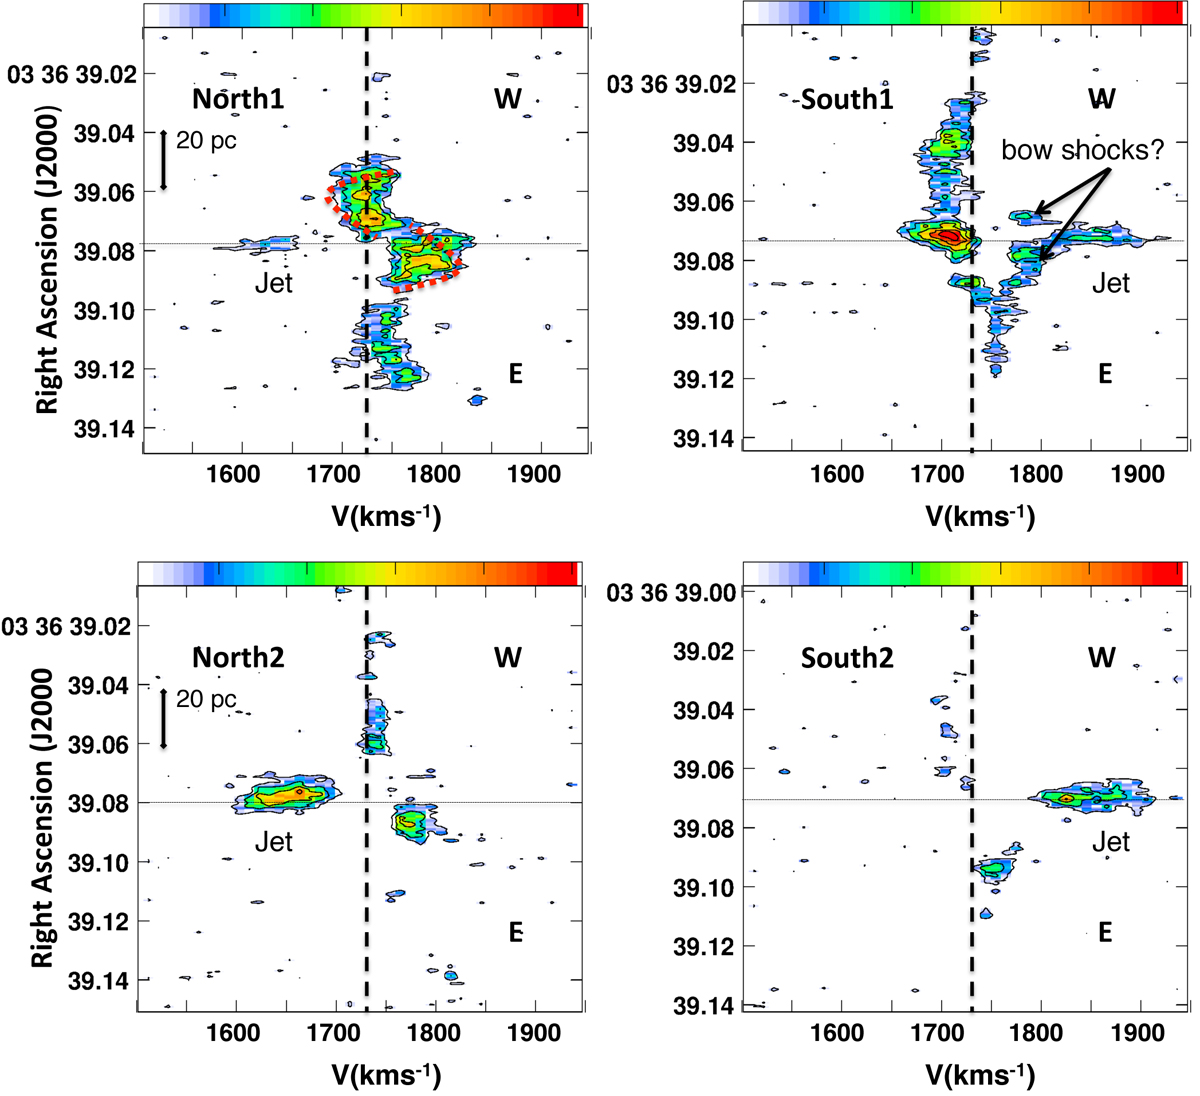
Position-velocity (pV) diagrams of CO 3–2 across the jet axis. Contour levels are 0.6 × (1,2,3,4) mJy beam−1, and colour range from 0.6 to 30 mJy. The horizontal dotted line indicates the jet symmetry axis. Top left panel: cut ![]() to the north of the nucleus. The expected signature of a rotating wind is indicated with red dashed curves (see Fig. 12 and Sect. 7.1.1). Lower left panel: cut
to the north of the nucleus. The expected signature of a rotating wind is indicated with red dashed curves (see Fig. 12 and Sect. 7.1.1). Lower left panel: cut ![]() to the north of the nucleus. Top right panel: cut
to the north of the nucleus. Top right panel: cut ![]() to the south of the nucleus. Lower right panel: cut
to the south of the nucleus. Lower right panel: cut ![]() to the north of the nucleus. The arrows point to structures that are proposed to be bow shocks (see Sect. 6.4).
to the north of the nucleus. The arrows point to structures that are proposed to be bow shocks (see Sect. 6.4).
Current usage metrics show cumulative count of Article Views (full-text article views including HTML views, PDF and ePub downloads, according to the available data) and Abstracts Views on Vision4Press platform.
Data correspond to usage on the plateform after 2015. The current usage metrics is available 48-96 hours after online publication and is updated daily on week days.
Initial download of the metrics may take a while.