Fig. 5.
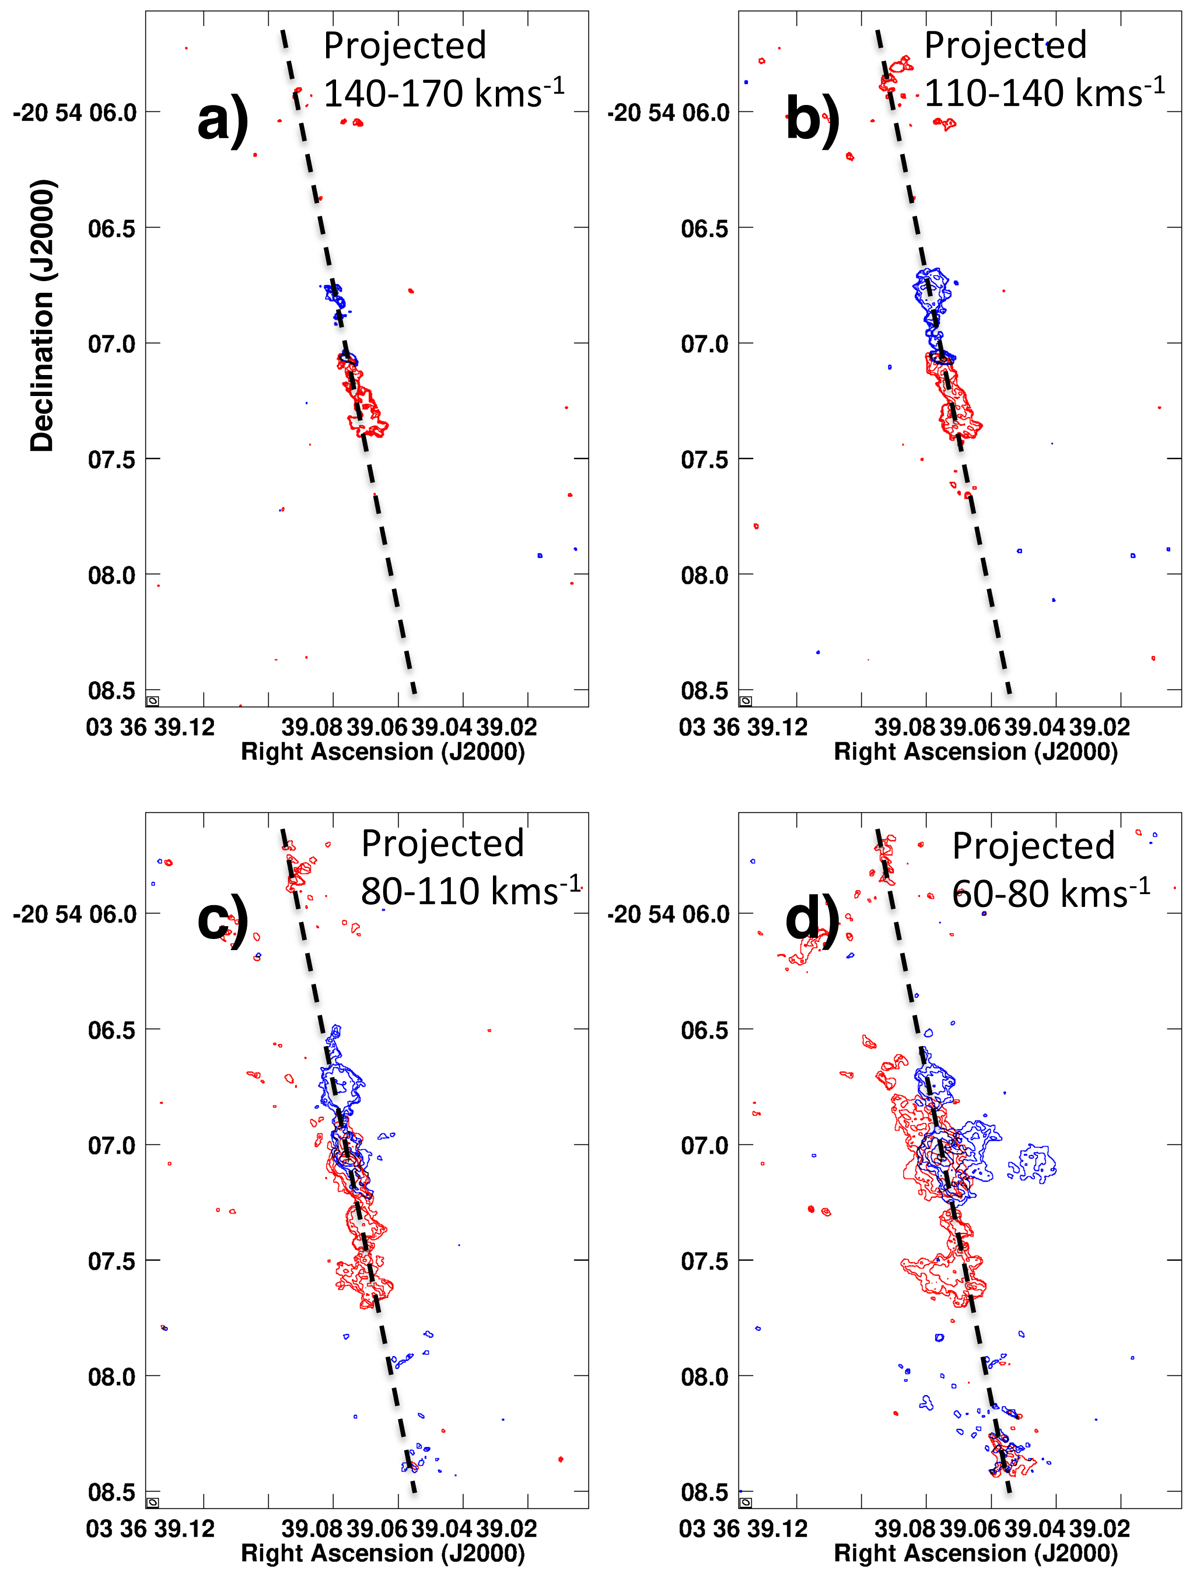
Panels showing the structure of the jet at various velocity intervals: Top left panel: highest velocity, projected velocities 140–170 km s−1. Top right: high-velocity, projected velocities 110–140 km s−1. Bottom left: intermediate velocity, projected velocities 80–110 km s−1. Bottom right: lower velocity 60–80 km s−1. The black dashed line shows the orientation of the jet axis. Contour levels are (for the blue- and redshifted emission respectively): 0.004 × (1,2,3,4,5) (panel a); 0.004 ×(1,2,4,8,16,32) (panel b); 0.004 × (1,5,10,20,50) Jy beam−1kms−1 (panels c and d).
Current usage metrics show cumulative count of Article Views (full-text article views including HTML views, PDF and ePub downloads, according to the available data) and Abstracts Views on Vision4Press platform.
Data correspond to usage on the plateform after 2015. The current usage metrics is available 48-96 hours after online publication and is updated daily on week days.
Initial download of the metrics may take a while.