Fig. 11.
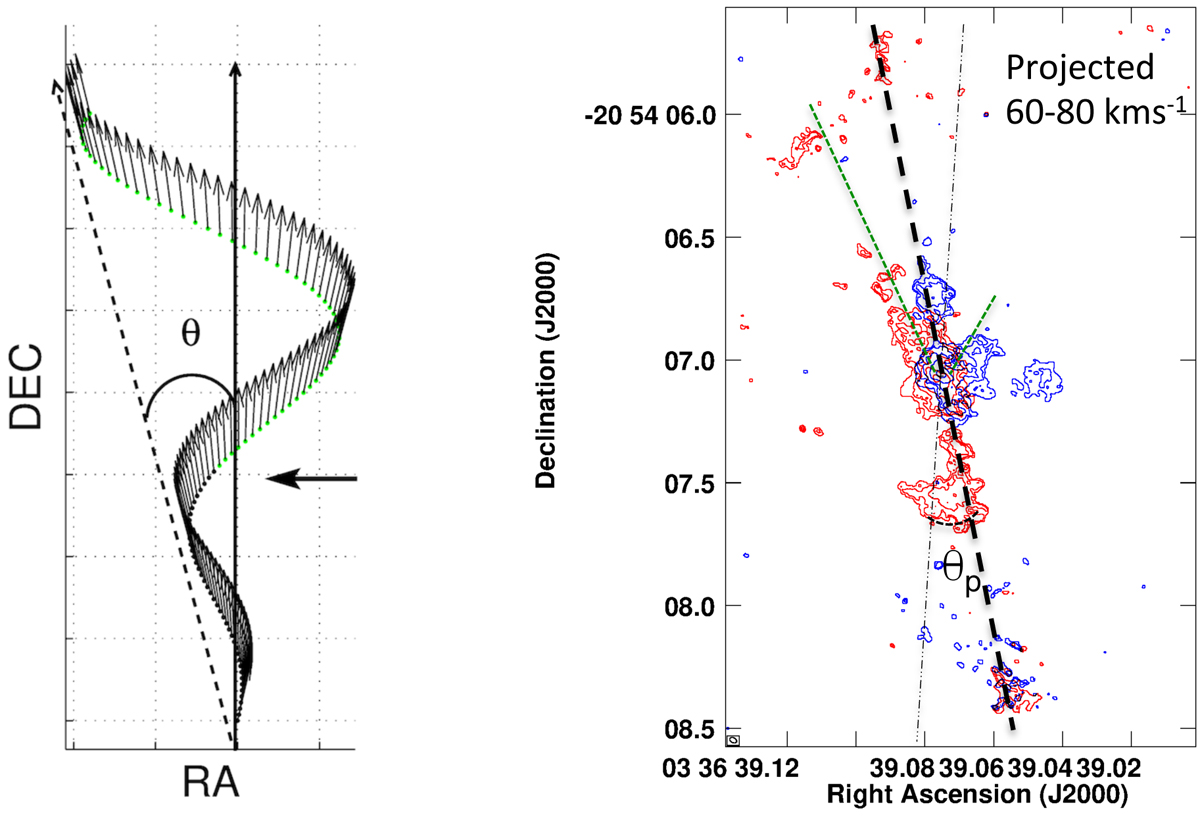
Left: schematic of the simple precession model by Aalto et al. (2016) showing the precession angle θ. Right: lower velocity (60–80 km s−1) jet emission (from Fig. 5). Contour levels are (for the blue- and redshifted emission respectively) 0.004 ×(1,5,10,20,50) Jy beam−1 kms−1. The thick black dashed line shows the orientation of the jet axis. The narrow wind is outlines in green and the suggested precession angle in a thin, dashed line
Current usage metrics show cumulative count of Article Views (full-text article views including HTML views, PDF and ePub downloads, according to the available data) and Abstracts Views on Vision4Press platform.
Data correspond to usage on the plateform after 2015. The current usage metrics is available 48-96 hours after online publication and is updated daily on week days.
Initial download of the metrics may take a while.