Fig. 6.
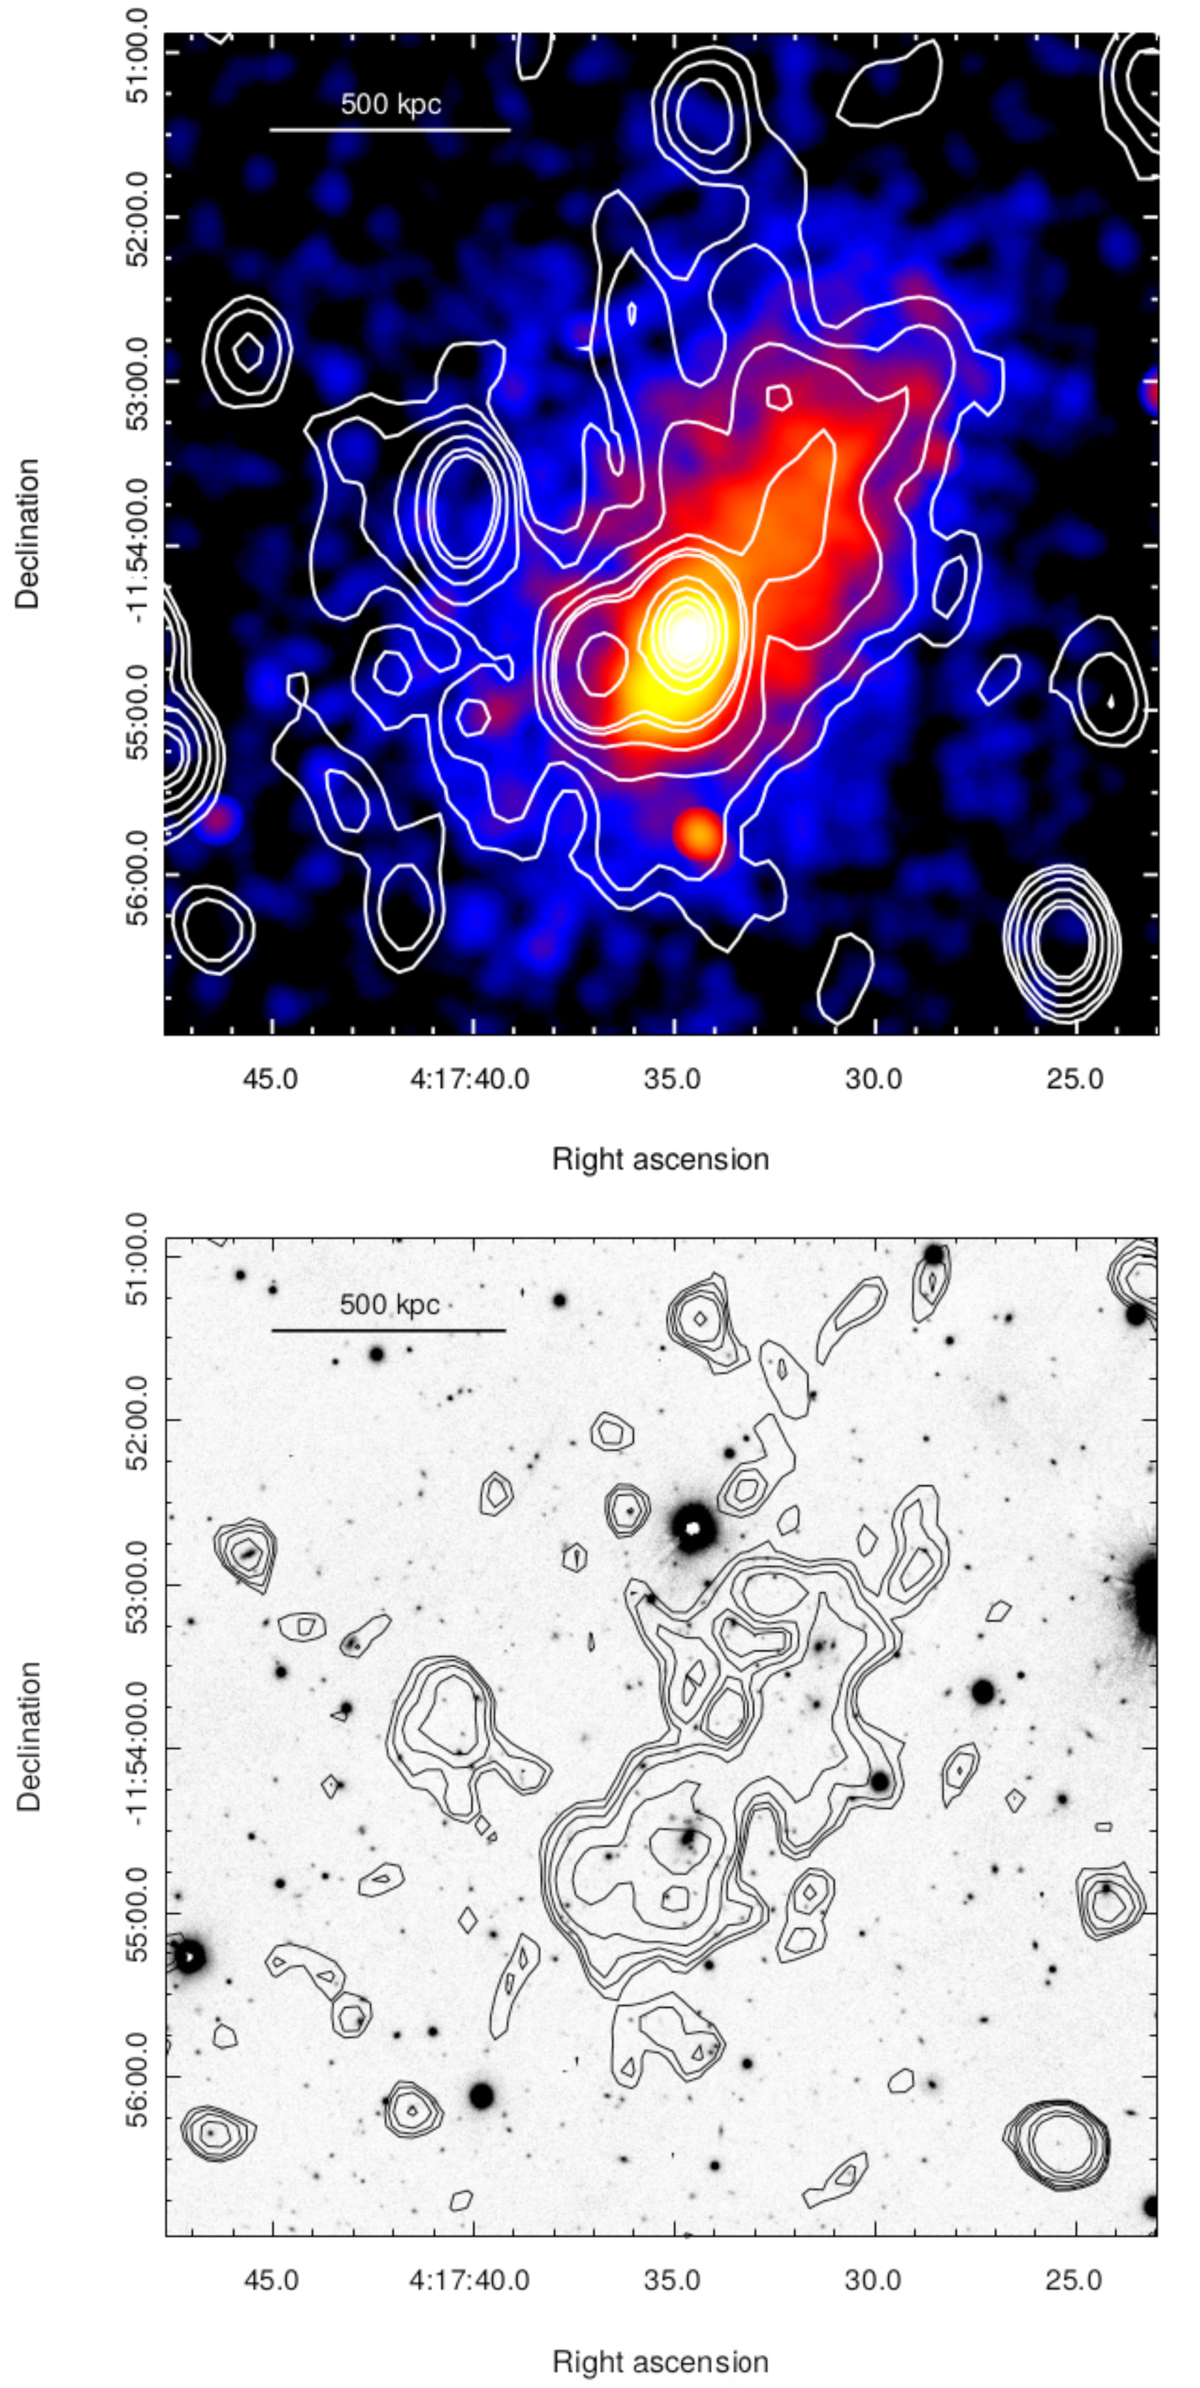
Top panel: radio contours at 1.5 GHz for the cluster MACS J0417.5−1154 overlaid on the Chandra X-ray image. Discrete sources have not been subtracted. The HPBW is 26.7″ × 18.8″ (PA = −1.2°). Contours are placed at 0.05, 0.1, 0.2, 0.4, 0.7, 0.9, 3, 5, 7, 9 mJy per beam; the noise level is 0.02 mJy per beam Bottom panel: contours of the diffuse radio source classified as a radio halo at the cluster center superposed on the optical image. Discrete sources in the halo region have been subtracted. The HPBW is 15″. The noise level is 0.03 mJy per beam; the shown contours mark −0.07, 0.05, 0.07, 0.1, 0.15, 0.3, 0.5 mJy per beam.
Current usage metrics show cumulative count of Article Views (full-text article views including HTML views, PDF and ePub downloads, according to the available data) and Abstracts Views on Vision4Press platform.
Data correspond to usage on the plateform after 2015. The current usage metrics is available 48-96 hours after online publication and is updated daily on week days.
Initial download of the metrics may take a while.