Fig. 5.
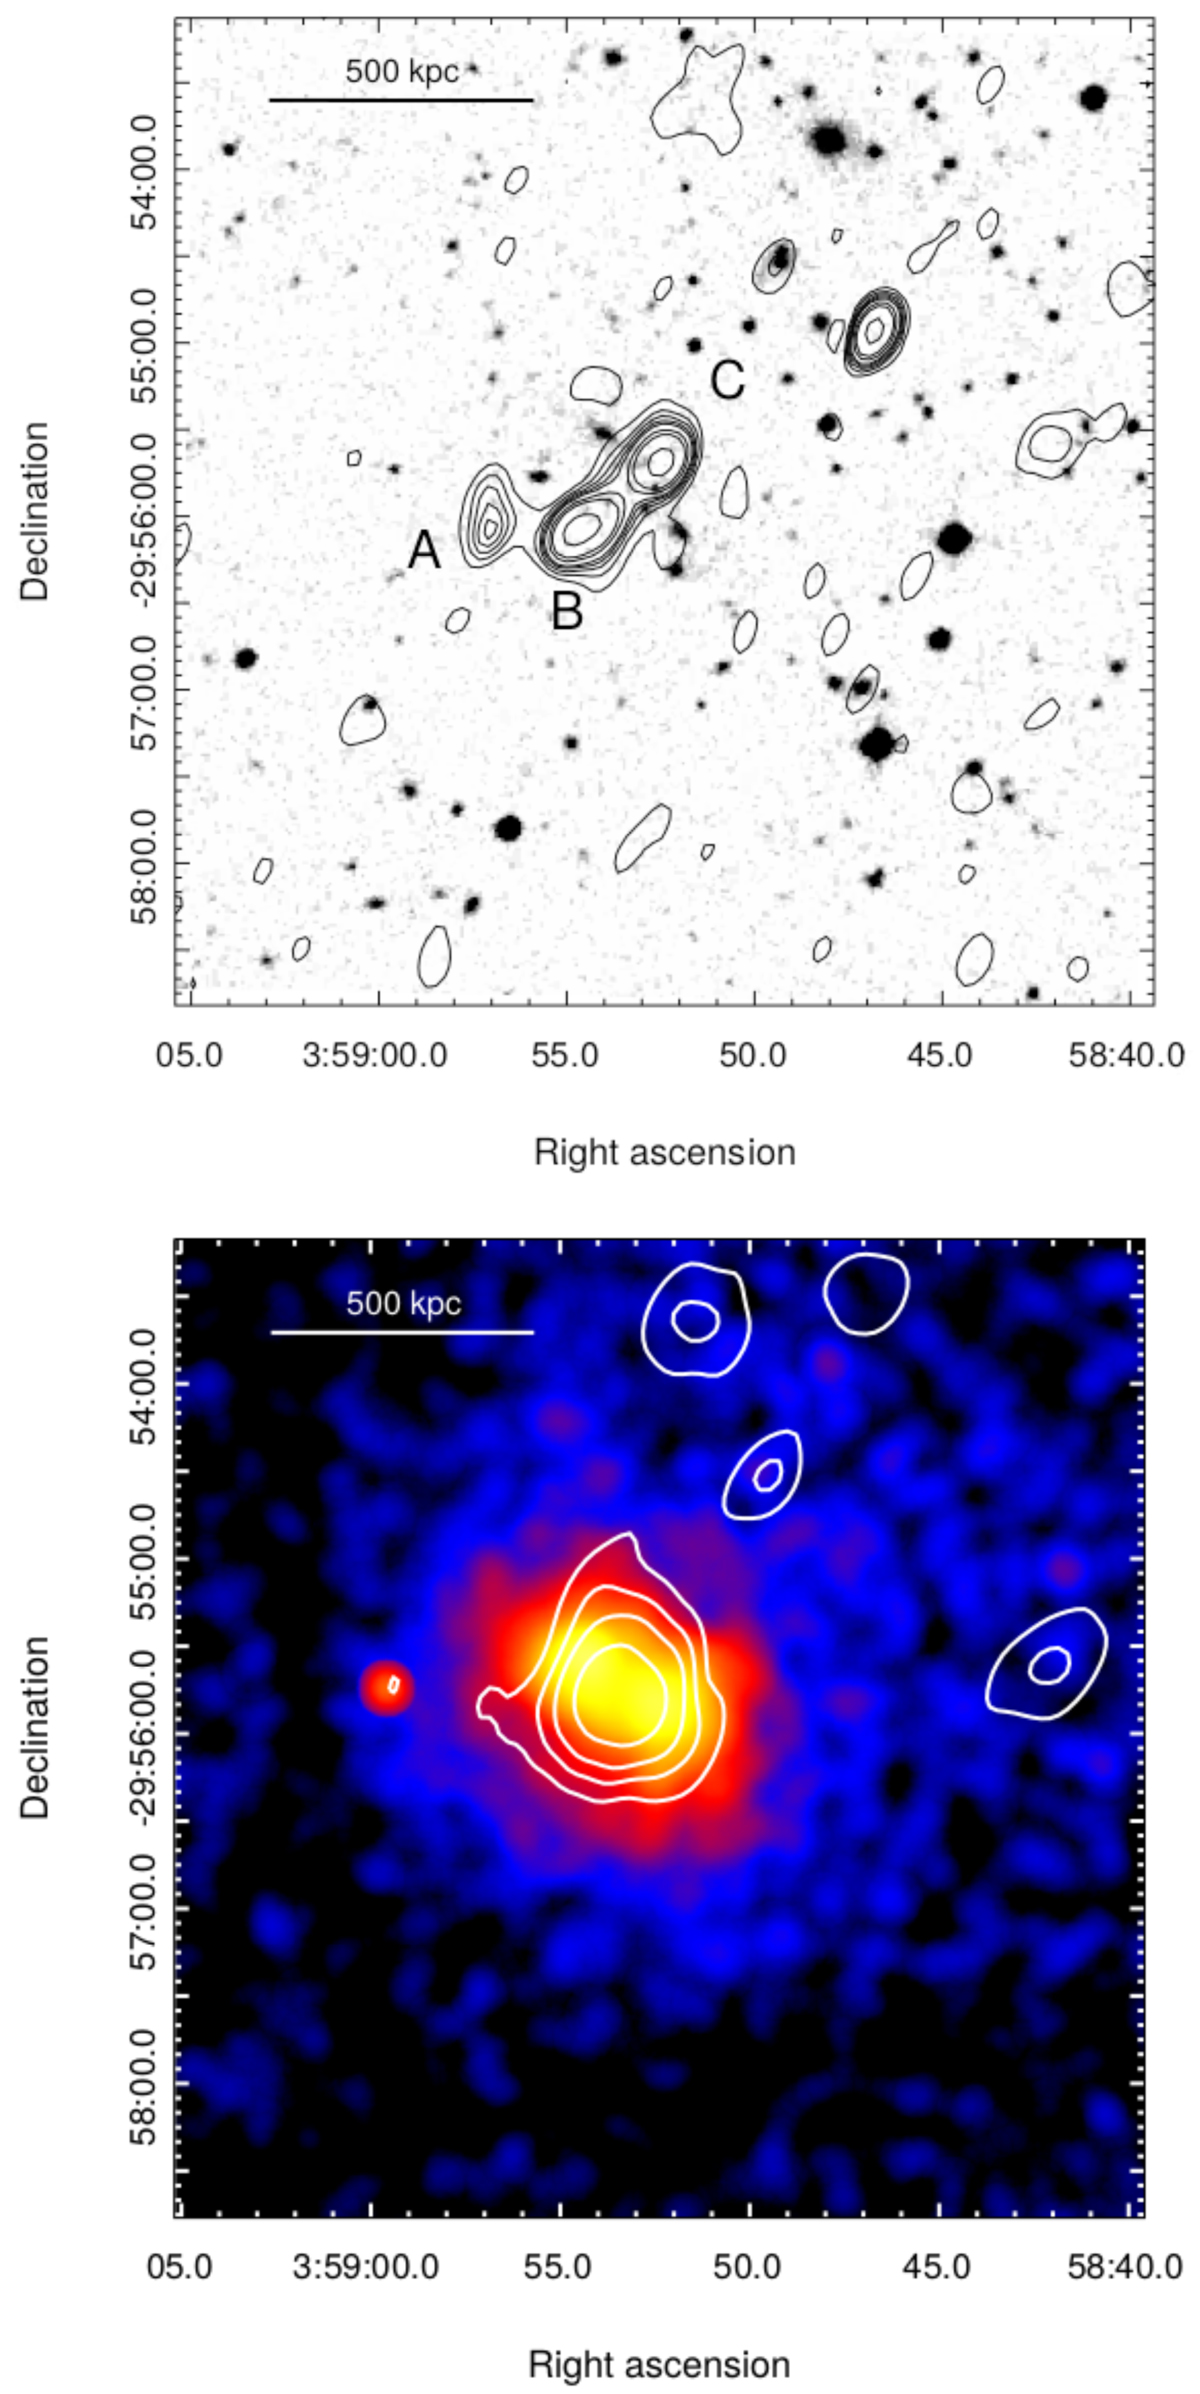
Top panel: total-intensity contours for the high-resolution image of MACS J0358.8−2955 (A3192) at 1.53 GHz overlaid on the optical image. Point sources at the cluster center are labeled as A, B and C. The image has an FWHM of 10″ × 15″ at PA 25°. The shown contour levels are (−0.3, 0.3, 0.2 … 3, 6, 9, 12, 24, 48, …) × σ with rms noise σ = 0.1 mJy per beam. Bottom panel: JVLA low-resolution radio contours after subtraction of discrete sources, superposed on the Chandra X-ray image. The radio HPBW is 35″ with a noise level of 0.11 mJy per beam. Contours are placed at 0.3, 0.5, 0.7 and 1 mJy per beam.
Current usage metrics show cumulative count of Article Views (full-text article views including HTML views, PDF and ePub downloads, according to the available data) and Abstracts Views on Vision4Press platform.
Data correspond to usage on the plateform after 2015. The current usage metrics is available 48-96 hours after online publication and is updated daily on week days.
Initial download of the metrics may take a while.