Fig. 3.
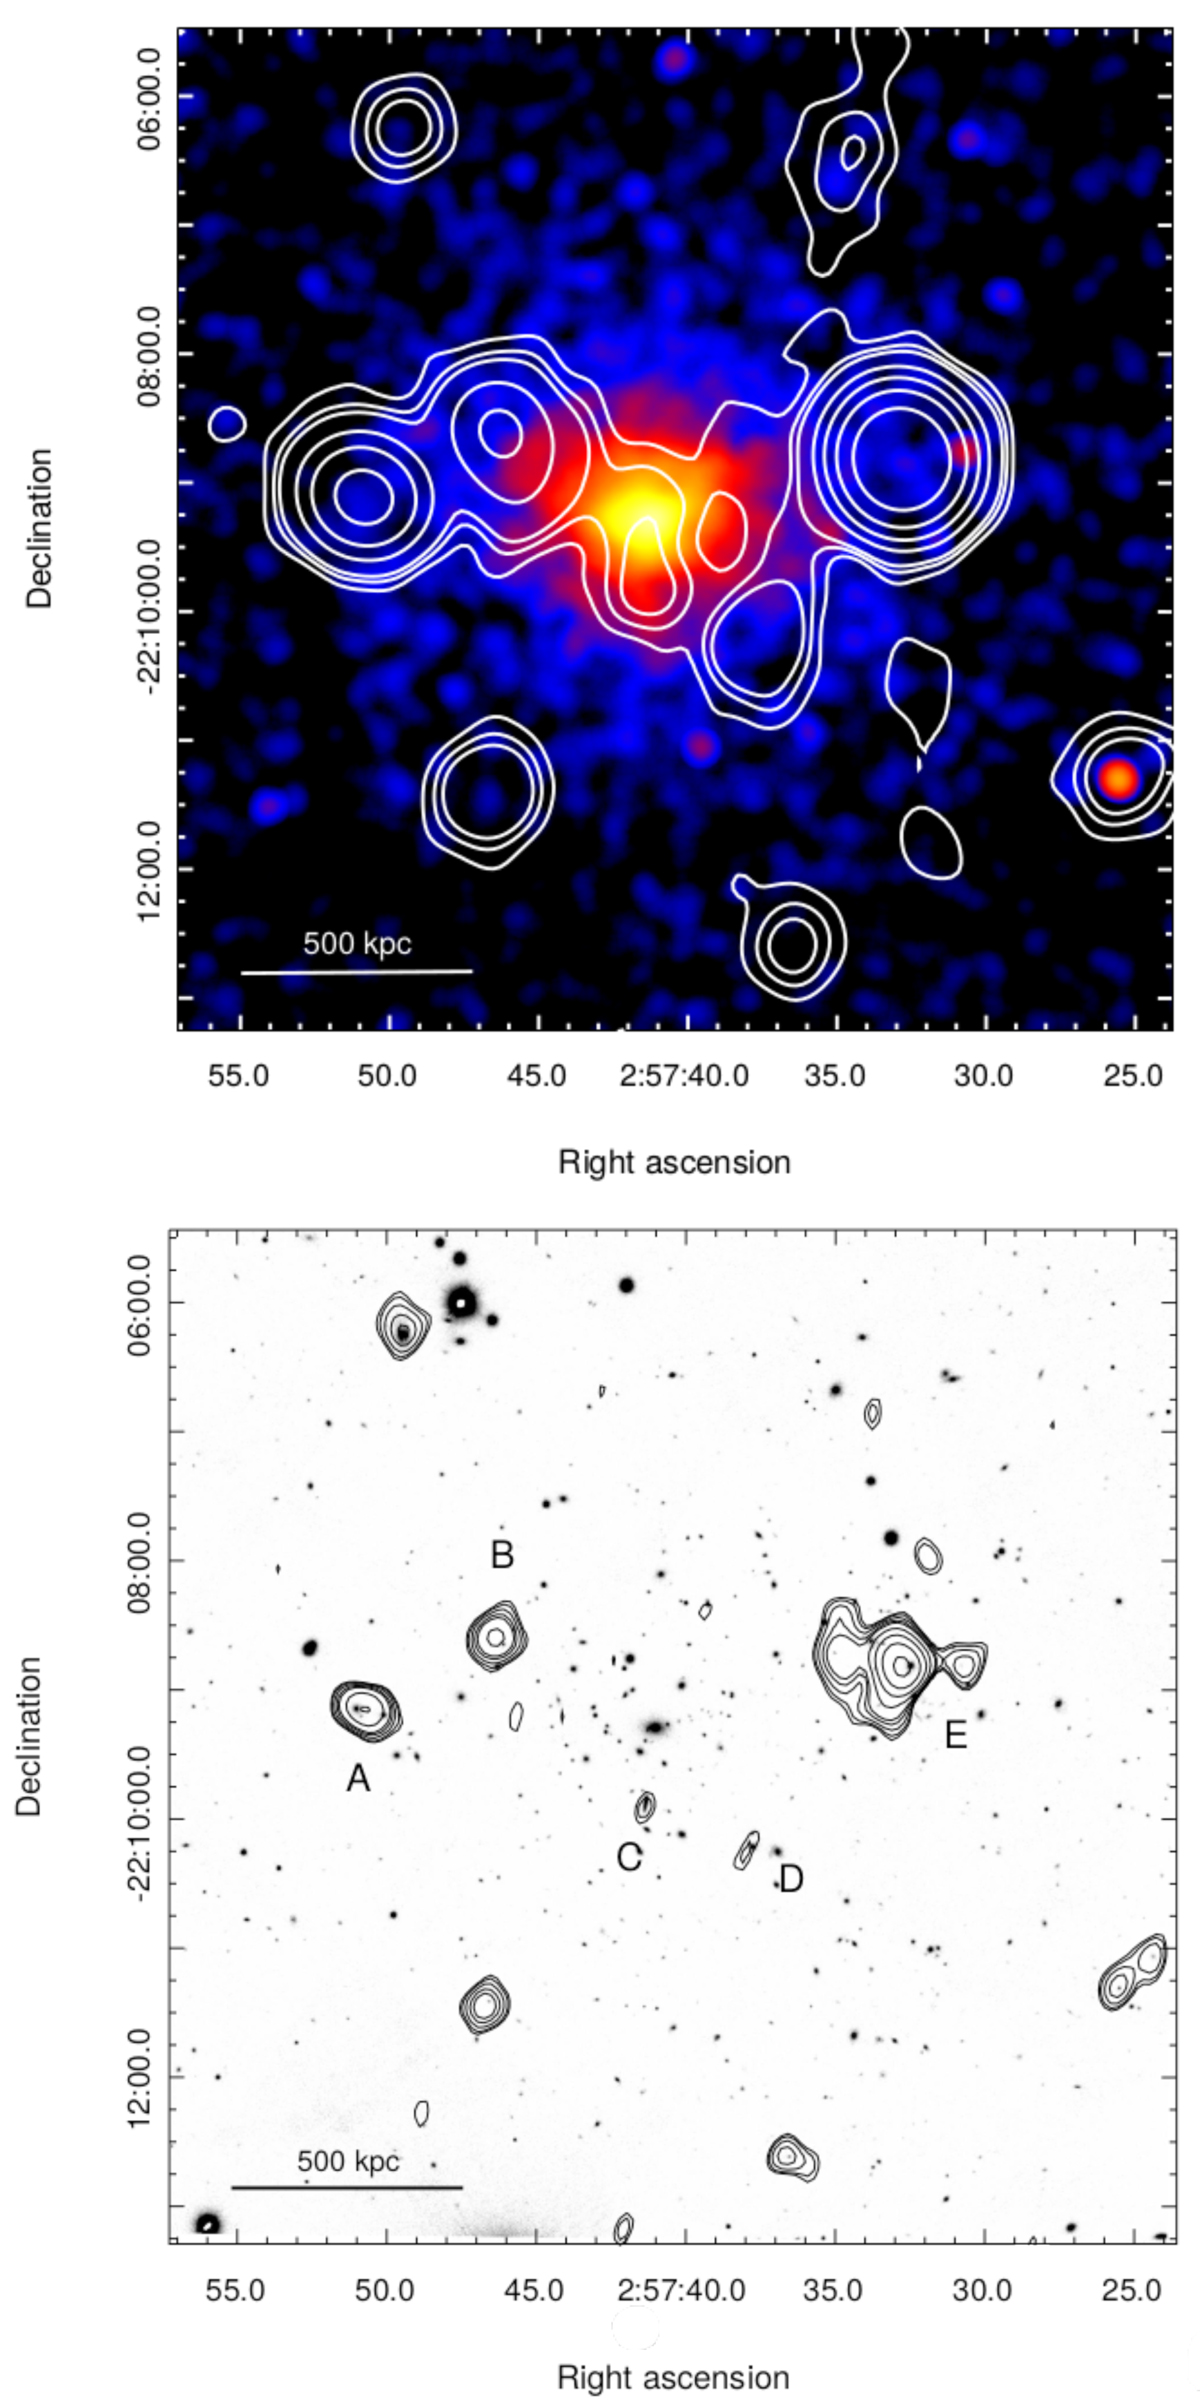
Top panel: MACS J0257.6−2209 (A402) – radio contours at 1.5 GHz (total intensity) as detected with the JVLA in C+D configuration overlaid on the Chandra X-ray image (color). The radio HPBW is 37″ (circular). Contour levels are 3, 6, 9, 12, … × σ with σ = 0.048 mJy per beam. Bottom panel: C array image of compact sources in the field of MACS J0257.6−2209, obtained with the longest baselines only, overlaid on the optical image. The HPBW is 15″ (circular). Contour levels are 3, 4, 6, 9, 24, 38, 48, 78, 96 ×σ with σ = 0.04 mJy per beam. Discrete sources are labelled as A, B, C, D, and E.
Current usage metrics show cumulative count of Article Views (full-text article views including HTML views, PDF and ePub downloads, according to the available data) and Abstracts Views on Vision4Press platform.
Data correspond to usage on the plateform after 2015. The current usage metrics is available 48-96 hours after online publication and is updated daily on week days.
Initial download of the metrics may take a while.